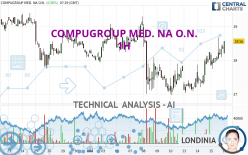
COMPUGROUP MED. NA O.N. - 1H - Technical analysis published on 05/16/2024 (GMT)
- 62
- 0
Click here for a new analysis!
- Timeframe : 1H
- - Analysis generated on
- Status : LEVEL MAINTAINED

Summary of the analysis

Additional analysis
Quotes
The COMPUGROUP MED. NA O.N. price is 28.36 EUR. The price registered a decrease of -0.14% on the session and was traded between 28.20 EUR and 28.38 EUR over the period. The price is currently at +0.57% from its lowest and -0.07% from its highest.A bearish opening was detected by the Central Gaps scanner. Sellers are trying to impose a bearish trend in the very short term.
Bearish opening
Type : Bearish
Timeframe : Openning
Here is a more detailed summary of the historical variations registered by COMPUGROUP MED. NA O.N.:
Near a new LOW record (5 years)
Type : Bearish
Timeframe : Weekly
Near a new LOW record (1 year)
Type : Bearish
Timeframe : Weekly
Near a new LOW record (1st january)
Type : Bearish
Timeframe : Weekly
Near a new HIGH record (1 month)
Type : Bullish
Timeframe : Weekly
Technical
Technical analysis of this 1H chart of COMPUGROUP MED. NA O.N. indicates that the overall trend is bullish. The signals returned by the moving averages are 67.86% bullish. This bullish trend is reinforced by the strong signals currently being given by short-term moving averages. The Central Indicators market scanner is currently detecting several bearish signals that could impact this trend:
Bearish price crossover with Moving Average 100
Type : Bearish
Timeframe : 1 hour
Bearish price crossover with adaptative moving average 100
Type : Bearish
Timeframe : 1 hour
In fact, 14 technical indicators on 18 studied are currently bullish. Caution: the Central Indicators scanner currently detects an excess:
RSI indicator: bearish divergence
Type : Bearish
Timeframe : 1 hour
Williams %R indicator is overbought : over -20
Type : Neutral
Timeframe : 1 hour
Price is back over the pivot point
Type : Bullish
Timeframe : 1 hour
Price is back over the pivot point
Type : Bullish
Timeframe : Weekly
The Central Patterns scanner, which studies chart patterns, resistances and supports, has identified this signal:
Resistance of channel is broken
Type : Bullish
Timeframe : 1 hour
The Central Candlesticks scanner, specialised in Japanese candlesticks, did not identify any signals.
| S3 | S2 | S1 | Price | R1 | R2 | R3 | |
|---|---|---|---|---|---|---|---|
| ProTrendLines | 27.40 | 27.92 | 28.24 | 28.36 | 28.83 | 29.29 | 29.66 |
| Change (%) | -3.39% | -1.55% | -0.42% | - | +1.66% | +3.28% | +4.58% |
| Change | -0.96 | -0.44 | -0.12 | - | +0.47 | +0.93 | +1.30 |
| Level | Minor | Major | Minor | - | Major | Intermediate | Minor |
Pivot points can also be used to set your price objectives. Here is the price situation in relation to pivot points:
| Pivot points | S3 | S2 | S1 | PP | R1 | R2 | R3 |
|---|---|---|---|---|---|---|---|
| Standard | 26.93 | 27.33 | 27.87 | 28.27 | 28.81 | 29.21 | 29.75 |
| Camarilla | 28.14 | 28.23 | 28.31 | 28.40 | 28.49 | 28.57 | 28.66 |
| Woodie | 26.99 | 27.37 | 27.93 | 28.31 | 28.87 | 29.25 | 29.81 |
| Fibonacci | 27.33 | 27.69 | 27.91 | 28.27 | 28.63 | 28.85 | 29.21 |
| Pivot points | S3 | S2 | S1 | PP | R1 | R2 | R3 |
|---|---|---|---|---|---|---|---|
| Standard | 24.41 | 25.69 | 26.75 | 28.03 | 29.09 | 30.37 | 31.43 |
| Camarilla | 27.18 | 27.39 | 27.61 | 27.82 | 28.04 | 28.25 | 28.46 |
| Woodie | 24.31 | 25.64 | 26.65 | 27.98 | 28.99 | 30.32 | 31.33 |
| Fibonacci | 25.69 | 26.58 | 27.13 | 28.03 | 28.92 | 29.47 | 30.37 |
| Pivot points | S3 | S2 | S1 | PP | R1 | R2 | R3 |
|---|---|---|---|---|---|---|---|
| Standard | 23.34 | 25.48 | 26.80 | 28.94 | 30.26 | 32.40 | 33.72 |
| Camarilla | 27.17 | 27.49 | 27.80 | 28.12 | 28.44 | 28.75 | 29.07 |
| Woodie | 22.93 | 25.28 | 26.39 | 28.74 | 29.85 | 32.20 | 33.31 |
| Fibonacci | 25.48 | 26.80 | 27.62 | 28.94 | 30.26 | 31.08 | 32.40 |
Numerical data
The following are the details of the technical indicators and moving averages that were collected to generate this technical analysis:
| RSI (14): | 63.76 | |
| MACD (12,26,9): | 0.2100 | |
| Directional Movement: | 19.75 | |
| AROON (14): | 71.43 | |
| DEMA (21): | 28.23 | |
| Parabolic SAR (0,02-0,02-0,2): | 28.00 | |
| Elder Ray (13): | 0.19 | |
| Super Trend (3,10): | 27.58 | |
| Zig ZAG (10): | 28.36 | |
| VORTEX (21): | 1.1600 | |
| Stochastique (14,3,5): | 76.80 | |
| TEMA (21): | 28.42 | |
| Williams %R (14): | -23.88 | |
| Chande Momentum Oscillator (20): | 0.48 | |
| Repulse (5,40,3): | 1.0100 | |
| ROCnROLL: | 1 | |
| TRIX (15,9): | 0.0900 | |
| Courbe Coppock: | 5.08 |
| MA7: | 27.87 | |
| MA20: | 28.44 | |
| MA50: | 28.59 | |
| MA100: | 31.98 | |
| MAexp7: | 28.24 | |
| MAexp20: | 27.98 | |
| MAexp50: | 27.85 | |
| MAexp100: | 28.05 | |
| Price / MA7: | +1.76% | |
| Price / MA20: | -0.28% | |
| Price / MA50: | -0.80% | |
| Price / MA100: | -11.32% | |
| Price / MAexp7: | +0.42% | |
| Price / MAexp20: | +1.36% | |
| Price / MAexp50: | +1.83% | |
| Price / MAexp100: | +1.11% |
News
The latest news and videos published on COMPUGROUP MED. NA O.N. at the time of the analysis were as follows:
- EQS-News: CompuGroup Medical with solid first quarter against strong prior year
- EQS-News: CompuGroup Medical successfully completes share buyback program
- EQS-News: CGM proposes dividend of EUR 1.00 to be passed at virtual AGM in May
- EQS-Adhoc: CompuGroup Medical SE & Co. KGaA adopts resolution on share buy-back program for up to 500,000 shares
- EQS-News: CompuGroup Medical US announces CEO transition
About author
Online


Add a comment
Comments
0 comments on the analysis COMPUGROUP MED. NA O.N. - 1H