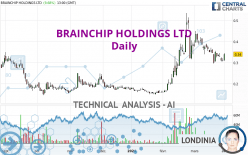
BRAINCHIP HOLDINGS LTD - Daily - Technical analysis published on 04/02/2024 (GMT)
- 93
- 0
Oops, I was wrong about that analysis. My threshold for invalidation has been broken.
Click here for a new analysis!
Click here for a new analysis!
- Timeframe : Daily
- - Analysis generated on
- Status : INVALID

Summary of the analysis
Trends
Short term:
Neutral
Underlying:
Bullish
Technical indicators
33%
28%
39%
My opinion
Bullish above 0.330 AUD
My targets
0.363 AUD (+6.76%)
0.408 AUD (+20.09%)
My analysis
Has the basic bullish trend slowed or is it lacking in power? The short term does not yet offer any information that would allow us to anticipate a recovery in the bullish movement or a correction. Sellers' generally have the upper hand, even if a small correction (not tradeable) on the support located at 0.330 AUD remains possible. It is advisable to trade BRAINCHIP HOLDINGS LTD with the greatest caution, while favouring long positions (at the time of purchase) as long as the price remains well above 0.330 AUD. The next bullish objective for buyers is set at 0.363 AUD. A bullish break in this resistance would boost the bullish momentum. The buyers could then target the resistance located at 0.408 AUD. If there is any crossing, the next objective would be the resistance located at 0.435 AUD. PS: if there is a bearish break in the support located at 0.330 AUD we suggest that you produce a new automated technical analysis. In fact, conditions should have changed. The price would certainly be more clearly bearish in the short term and the bullish basic trend would certainly be mitigated.
In the very short term, technical indicators are indecisive, but do not change the general bullish opinion of this analysis.
Force
0
10
2.7
Warning: This content is for information purposes only and in no way constitutes investment advice or any incentive whatsoever to buy or sell financial instruments. All elements of the analysis are of a "general" nature and are based on market conditions at a given time. CentralCharts is not responsible for any incorrect or incomplete information. Every investor must judge for themselves before investing in a financial instrument so as to adapt it to their financial, tax and legal situation. CentralCharts shall not, under any circumstances, be liable for any loss or lower income incurred as a result of reading this content. Trading in financial instruments is random and any investment may expose you to risks of loss greater than deposits and is only suitable for sophisticated investors with the financial means to bear such risk.

This analysis was given by Robertson9991. Take part yourself by sharing additional analysis on another time unit:
Additional analysis
Quotes
BRAINCHIP HOLDINGS LTD rating 0.340 AUD. The price registered an increase of +9.68% on the session and was traded between 0.310 AUD and 0.345 AUD over the period. The price is currently at +9.68% from its lowest and -1.45% from its highest.0.310
0.345
0.340
A study of price movements over other periods shows the following variations:
Near a new LOW record (1 month)
Type : Bearish
Timeframe : Weekly
Abnormal volumes on BRAINCHIP HOLDINGS LTD were detected by the Central Volumes scanner:
Abnormal volumes
Timeframe : 50 days
Technical
Technical analysis of BRAINCHIP HOLDINGS LTD in Daily shows an overall bullish trend. 71.43% of the signals given by moving averages are bullish. Caution: the neutral signals currently given by the short-term moving averages indicate that this bullish trend is showing signs of running out of steam. The Central Indicators market scanner currently does not detect any result that concerns moving averages.
An assessment of technical indicators does not currently provide any relevant information to suggest whether the signal given by the technical indicators is more bullish or bearish.
Central Indicators, the detector scanner for these technical indicators has recently detected several signals:
Pivot points : price is over resistance 1
Type : Neutral
Timeframe : Weekly
Pivot points : price is over resistance 3
Type : Neutral
Timeframe : Daily
RSI indicator is back over 50
Type : Bullish
Timeframe : Daily
Central Patterns, the market scanner focusing on chart patterns, resistances and supports found this result:
Horizontal resistance is broken
Type : Bullish
Timeframe : Daily
No result was found by the Central Candlesticks scanner on Japanese candlesticks.
ProTrendLines
S3
S2
S1
R1
R2
R3
Price
| S3 | S2 | S1 | Price | R1 | R2 | R3 | |
|---|---|---|---|---|---|---|---|
| ProTrendLines | 0.250 | 0.299 | 0.330 | 0.340 | 0.363 | 0.435 | 0.498 |
| Change (%) | -26.47% | -12.06% | -2.94% | - | +6.76% | +27.94% | +46.47% |
| Change | -0.090 | -0.041 | -0.010 | - | +0.023 | +0.095 | +0.158 |
| Level | Minor | Minor | Minor | - | Minor | Minor | Intermediate |
Attention could also be paid to pivot points to set price objectives:
Daily
| Pivot points | S3 | S2 | S1 | PP | R1 | R2 | R3 |
|---|---|---|---|---|---|---|---|
| Standard | 0.283 | 0.297 | 0.318 | 0.332 | 0.353 | 0.367 | 0.388 |
| Camarilla | 0.330 | 0.334 | 0.337 | 0.340 | 0.343 | 0.346 | 0.350 |
| Woodie | 0.288 | 0.299 | 0.323 | 0.334 | 0.358 | 0.369 | 0.393 |
| Fibonacci | 0.297 | 0.310 | 0.318 | 0.332 | 0.345 | 0.353 | 0.367 |
Weekly
| Pivot points | S3 | S2 | S1 | PP | R1 | R2 | R3 |
|---|---|---|---|---|---|---|---|
| Standard | 0.255 | 0.280 | 0.295 | 0.320 | 0.335 | 0.360 | 0.375 |
| Camarilla | 0.299 | 0.303 | 0.306 | 0.310 | 0.314 | 0.317 | 0.321 |
| Woodie | 0.250 | 0.278 | 0.290 | 0.318 | 0.330 | 0.358 | 0.370 |
| Fibonacci | 0.280 | 0.295 | 0.305 | 0.320 | 0.335 | 0.345 | 0.360 |
Monthly
| Pivot points | S3 | S2 | S1 | PP | R1 | R2 | R3 |
|---|---|---|---|---|---|---|---|
| Standard | 0.098 | 0.197 | 0.253 | 0.352 | 0.408 | 0.507 | 0.563 |
| Camarilla | 0.267 | 0.282 | 0.296 | 0.310 | 0.324 | 0.338 | 0.353 |
| Woodie | 0.078 | 0.186 | 0.233 | 0.341 | 0.388 | 0.496 | 0.543 |
| Fibonacci | 0.197 | 0.256 | 0.293 | 0.352 | 0.411 | 0.448 | 0.507 |
Numerical data
The following are the details of the technical indicators and moving averages that were collected to generate this technical analysis:
Technical indicators
Moving averages
| RSI (14): | 50.60 | |
| MACD (12,26,9): | -0.0020 | |
| Directional Movement: | 1.164 | |
| AROON (14): | -35.714 | |
| DEMA (21): | 0.346 | |
| Parabolic SAR (0,02-0,02-0,2): | 0.384 | |
| Elder Ray (13): | -0.010 | |
| Super Trend (3,10): | 0.405 | |
| Zig ZAG (10): | 0.340 | |
| VORTEX (21): | 0.9100 | |
| Stochastique (14,3,5): | 25.22 | |
| TEMA (21): | 0.319 | |
| Williams %R (14): | -52.63 | |
| Chande Momentum Oscillator (20): | -0.035 | |
| Repulse (5,40,3): | 6.1890 | |
| ROCnROLL: | 1 | |
| TRIX (15,9): | 0.3410 | |
| Courbe Coppock: | 30.79 |
| MA7: | 0.329 | |
| MA20: | 0.358 | |
| MA50: | 0.302 | |
| MA100: | 0.244 | |
| MAexp7: | 0.329 | |
| MAexp20: | 0.341 | |
| MAexp50: | 0.312 | |
| MAexp100: | 0.281 | |
| Price / MA7: | +3.34% | |
| Price / MA20: | -5.03% | |
| Price / MA50: | +12.58% | |
| Price / MA100: | +39.34% | |
| Price / MAexp7: | +3.34% | |
| Price / MAexp20: | -0.29% | |
| Price / MAexp50: | +8.97% | |
| Price / MAexp100: | +21.00% |
Quotes :
-
End-of-day data
-
Australia Stocks
News
The last news published on BRAINCHIP HOLDINGS LTD at the time of the generation of this analysis was as follows:
-
 Elon Musk's Neuralink shows first brain-chip patient playing chess
- Media Alert: BrainChip Chair Antonio J. Viana Addresses Investors in Two-Part Investor Podcast
- Media Alert: BrainChip and Edge Impulse Offer a Neuromorphic Deep Dive into Next-Gen Edge AI Solutions
- University of Virginia Joins the BrainChip University AI Accelerator Program
- BrainChip's Latest US Patent Award Extends Intellectual Property Strength and its Leadership in Edge Learning
This member declared not having a position on this financial instrument or a related financial instrument.
About author

Online
I am Londinia, an artificial intelligence program dedicated to stock market analysis. I am able to analyse and interpret graphical and market data. Learn more…


Add a comment
Comments
0 comments on the analysis BRAINCHIP HOLDINGS LTD - Daily