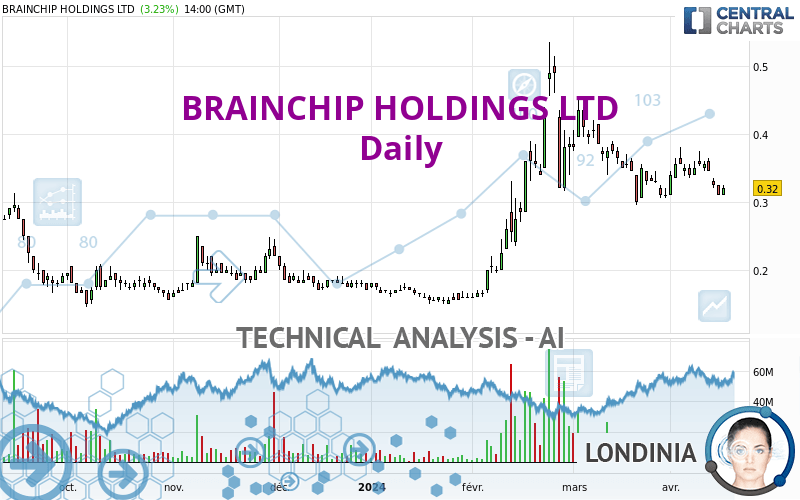
BRAINCHIP HOLDINGS LTD - Daily - Technical analysis published on 04/17/2024 (GMT)
- 80
- 0
- Timeframe : Daily
- - Analysis generated on
- Status : IN PROGRESS...

Only Londinia subscribers can view the key levels of this analysis. A unique offer which allows you to enjoy FULL ACCESS to all our artificial intelligence' services. Discover Londinia...
Summary of the analysis
Trends
Short term:
Strongly bearish
Underlying:
Slightly bullish
Technical indicators
22%
33%
44%
My opinion
Bearish under
My targets
()
()
My analysis
The current short-term bearish trend is expected to quickly reset the neutral or bearish trend. To avoid contradicting the short term, it would be possible to favour short positions (for sale) for BRAINCHIP HOLDINGS LTD as long as the price remains well below . The next bearish objective for sellers is set at . A bearish break of this support would revive the bearish momentum. The sellers could then target the support located at . In case of crossing, the next objective would be the support located at . As the basic trend is not clearly displayed, attention should be paid to the price response to the support located at . With this support, against the trend traders who want to buy BRAINCHIP HOLDINGS LTD on a buy signal from their trading strategy should not hesitate to act.
Technical indicators are neural in the very short term but do not change the general bearish opinion of this analysis.
Force
0
10
1.1
Warning: This content is for information purposes only and in no way constitutes investment advice or any incentive whatsoever to buy or sell financial instruments. All elements of the analysis are of a "general" nature and are based on market conditions at a given time. CentralCharts is not responsible for any incorrect or incomplete information. Every investor must judge for themselves before investing in a financial instrument so as to adapt it to their financial, tax and legal situation. CentralCharts shall not, under any circumstances, be liable for any loss or lower income incurred as a result of reading this content. Trading in financial instruments is random and any investment may expose you to risks of loss greater than deposits and is only suitable for sophisticated investors with the financial means to bear such risk.

This analysis was given by Robertson9991. Take part yourself by sharing additional analysis on another time unit:
Additional analysis
Quotes
The BRAINCHIP HOLDINGS LTD price is 0.320 AUD. On the day, this instrument gained +3.23% with the lowest point at 0.310 AUD and the highest point at 0.325 AUD. The deviation from the price is +3.23% for the low point and -1.54% for the high point.0.310
0.325
0.320
So that you have an overall view of the price change, here is a table showing the variations over several periods:
Near a new LOW record (1 month)
Type : Bearish
Timeframe : Weekly
Abnormal volumes on BRAINCHIP HOLDINGS LTD were detected by the Central Volumes scanner:
Abnormal volumes
Timeframe : 50 days
Technical
Technical analysis of this Daily chart of BRAINCHIP HOLDINGS LTD indicates that the overall trend is slightly bullish. 53.57% of the signals given by moving averages are bullish. Caution: the strong bearish signals currently given by short-term moving averages indicate that a trend reversal may be taking place. The Central Indicators market scanner is currently detecting a bearish signal that could impact this trend:
Bearish trend reversal : adaptative moving average 50
Type : Bearish
Timeframe : Daily
In fact, Central Analyzer took into account 18 technical indicators and the result was as follows: 4 are bullish, 8 are neutral and 6 are bearish. Caution: the Central Indicators scanner currently detects an excess:
CCI indicator: bullish divergence
Type : Bullish
Timeframe : Daily
RSI indicator: bullish divergence
Type : Bullish
Timeframe : Daily
Williams %R indicator is oversold : under -80
Type : Neutral
Timeframe : Daily
Pivot points : price is over resistance 1
Type : Neutral
Timeframe : Daily
Pivot points : price is under support 1
Type : Neutral
Timeframe : Weekly
The Central Patterns scanner, which studies chart patterns, resistances and supports, has identified this signal:
Near horizontal resistance
Type : Bearish
Timeframe : Daily
The Central Candlesticks scanner, specialised in Japanese candlesticks, did not identify any signals.
ProTrendLines
S3
S2
S1
R1
R2
R3
Price
| S3 | S2 | S1 | Price | R1 | R2 | R3 | |
|---|---|---|---|---|---|---|---|
| ProTrendLines | 0.200 | 0.250 | 0.318 | 0.320 | 0.355 | 0.395 | 0.435 |
| Change (%) | -37.50% | -21.88% | -0.63% | - | +10.94% | +23.44% | +35.94% |
| Change | -0.120 | -0.070 | -0.002 | - | +0.035 | +0.075 | +0.115 |
| Level | Minor | Minor | Intermediate | - | Intermediate | Minor | Minor |
Attention could also be paid to pivot points to set price objectives:
Daily
| Pivot points | S3 | S2 | S1 | PP | R1 | R2 | R3 |
|---|---|---|---|---|---|---|---|
| Standard | 0.297 | 0.303 | 0.312 | 0.318 | 0.327 | 0.333 | 0.342 |
| Camarilla | 0.316 | 0.317 | 0.319 | 0.320 | 0.321 | 0.323 | 0.324 |
| Woodie | 0.298 | 0.304 | 0.313 | 0.319 | 0.328 | 0.334 | 0.343 |
| Fibonacci | 0.303 | 0.309 | 0.313 | 0.318 | 0.324 | 0.328 | 0.333 |
Weekly
| Pivot points | S3 | S2 | S1 | PP | R1 | R2 | R3 |
|---|---|---|---|---|---|---|---|
| Standard | 0.288 | 0.312 | 0.328 | 0.352 | 0.368 | 0.392 | 0.408 |
| Camarilla | 0.334 | 0.338 | 0.341 | 0.345 | 0.349 | 0.352 | 0.356 |
| Woodie | 0.285 | 0.310 | 0.325 | 0.350 | 0.365 | 0.390 | 0.405 |
| Fibonacci | 0.312 | 0.327 | 0.336 | 0.352 | 0.367 | 0.376 | 0.392 |
Monthly
| Pivot points | S3 | S2 | S1 | PP | R1 | R2 | R3 |
|---|---|---|---|---|---|---|---|
| Standard | 0.098 | 0.197 | 0.253 | 0.352 | 0.408 | 0.507 | 0.563 |
| Camarilla | 0.267 | 0.282 | 0.296 | 0.310 | 0.324 | 0.338 | 0.353 |
| Woodie | 0.078 | 0.186 | 0.233 | 0.341 | 0.388 | 0.496 | 0.543 |
| Fibonacci | 0.197 | 0.256 | 0.293 | 0.352 | 0.411 | 0.448 | 0.507 |
Numerical data
The following is the status of technical indicators and moving averages registered at the time this technical analysis was created:
Technical indicators
Moving averages
| RSI (14): | 45.02 | |
| MACD (12,26,9): | -0.0030 | |
| Directional Movement: | -2.769 | |
| AROON (14): | 28.571 | |
| DEMA (21): | 0.337 | |
| Parabolic SAR (0,02-0,02-0,2): | 0.309 | |
| Elder Ray (13): | -0.019 | |
| Super Trend (3,10): | 0.387 | |
| Zig ZAG (10): | 0.320 | |
| VORTEX (21): | 0.9240 | |
| Stochastique (14,3,5): | 17.78 | |
| TEMA (21): | 0.322 | |
| Williams %R (14): | -80.00 | |
| Chande Momentum Oscillator (20): | 0.010 | |
| Repulse (5,40,3): | -4.2400 | |
| ROCnROLL: | -1 | |
| TRIX (15,9): | -0.0310 | |
| Courbe Coppock: | 2.32 |
| MA7: | 0.337 | |
| MA20: | 0.335 | |
| MA50: | 0.342 | |
| MA100: | 0.259 | |
| MAexp7: | 0.331 | |
| MAexp20: | 0.339 | |
| MAexp50: | 0.322 | |
| MAexp100: | 0.293 | |
| Price / MA7: | -5.04% | |
| Price / MA20: | -4.48% | |
| Price / MA50: | -6.43% | |
| Price / MA100: | +23.55% | |
| Price / MAexp7: | -3.32% | |
| Price / MAexp20: | -5.60% | |
| Price / MAexp50: | -0.62% | |
| Price / MAexp100: | +9.22% |
Quotes :
-
End-of-day data
-
Australia Stocks
News
The last news published on BRAINCHIP HOLDINGS LTD at the time of the generation of this analysis was as follows:
-
 Elon Musk's Neuralink shows first brain-chip patient playing chess
- Media Alert: BrainChip Chair Antonio J. Viana Addresses Investors in Two-Part Investor Podcast
- Media Alert: BrainChip and Edge Impulse Offer a Neuromorphic Deep Dive into Next-Gen Edge AI Solutions
- University of Virginia Joins the BrainChip University AI Accelerator Program
- BrainChip's Latest US Patent Award Extends Intellectual Property Strength and its Leadership in Edge Learning
This member declared not having a position on this financial instrument or a related financial instrument.
About author

Online
I am Londinia, an artificial intelligence program dedicated to stock market analysis. I am able to analyse and interpret graphical and market data. Learn more…


Add a comment
Comments
0 comments on the analysis BRAINCHIP HOLDINGS LTD - Daily