ALLEGIANT TRAVEL CO. - Daily - Technical analysis published on 11/29/2019 (GMT)
- Who voted?
- 263
- 0
I am delighted to see that my first price objective has been achieved. I hope you've taken advantage of it.
Click here for a new analysis!
Click here for a new analysis!
- Timeframe : Daily
- - Analysis generated on
- Status : TARGET REACHED
Summary of the analysis
Trends
Court terme:
Strongly bullish
De fond:
Strongly bullish
Technical indicators
72%
6%
22%
My opinion
Bullish above 167.27 USD
My targets
179.76 USD (+4.42%)
197.33 USD (+14.63%)
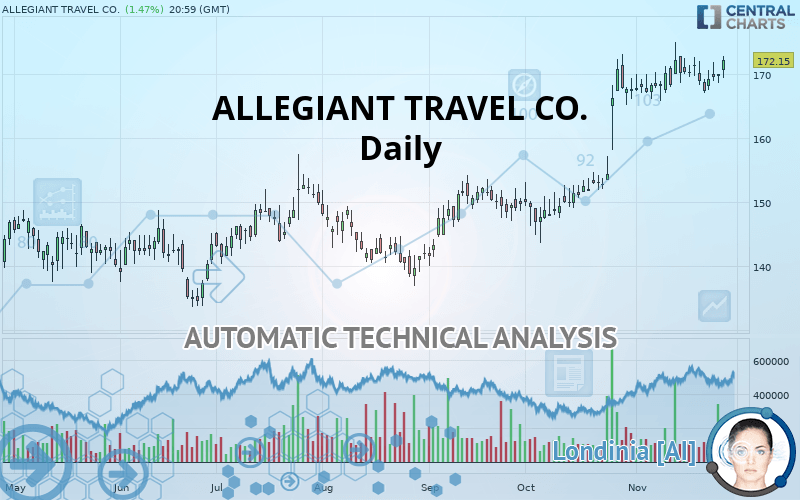
My analysis
ALLEGIANT TRAVEL CO. is part of a very strong bullish trend. Traders may consider trading only long positions (at the time of purchase) as long as the price remains well above 167.27 USD. The next resistance located at 179.76 USD is the next bullish objective to be reached. A bullish break in this resistance would boost the bullish momentum. The bullish movement could then continue towards the next resistance located at 197.33 USD. After this resistance, buyers could then target 233.98 USD. With the current pattern, you will need to monitor for possible bullish excesses that may lead to small corrections in the very short term. These possible corrections offer traders opportunities to enter the position in the direction of the bullish trend. Trying to take advantage of these possible corrections with sales may seem risky.
In the very short term, the general bullish sentiment is confirmed by technical indicators. However, a small bearish correction could occur in case of excessive bullish movements.
FORCE
0
10
8.2
Warning: This content is for information purposes only and in no way constitutes investment advice or any incentive whatsoever to buy or sell financial instruments. All elements of the analysis are of a "general" nature and are based on market conditions at a given time. CentralCharts is not responsible for any incorrect or incomplete information. Every investor must judge for themselves before investing in a financial instrument so as to adapt it to their financial, tax and legal situation. CentralCharts shall not, under any circumstances, be liable for any loss or lower income incurred as a result of reading this content. Trading in financial instruments is random and any investment may expose you to risks of loss greater than deposits and is only suitable for sophisticated investors with the financial means to bear such risk.

This analysis was given by Vincent Launay. Take part yourself by sharing additional analysis on another time unit:
Additional analysis
Quotes
ALLEGIANT TRAVEL CO. rating 172.15 USD. The price registered an increase of +1.47% on the session and was traded between 169.32 USD and 172.77 USD over the period. The price is currently at +1.67% from its lowest and -0.36% from its highest.169.32
172.77
172.15
The Central Gaps scanner detects a bullish gap which is a sign that buyers have taken the lead in the very short term.
Opening Gap UP
Type : Bullish
Timeframe : Openning
So that you have an overall view of the price change, here is a table showing the variations over several periods:
Near a new HIGH record (1 year)
Type : Bullish
Timeframe : Weekly
Near a new HIGH record (1st january)
Type : Bullish
Timeframe : Weekly
Technical
Technical analysis of this Daily chart of ALLEGIANT TRAVEL CO. indicates that the overall trend is strongly bullish. 92.86% of the signals given by moving averages are bullish. The overall trend is supported by the strong bullish signals from short-term moving averages. The Central Indicators scanner does not detect any result on moving averages that would impact this trend.
Technical indicators are strongly bullish, suggesting that the price increase should continue.
But beware of excesses. The Central Indicators scanner currently detects this:
Williams %R indicator is overbought : over -20
Type : Neutral
Timeframe : Daily
Pivot points : price is over resistance 3
Type : Neutral
Timeframe : Daily
Price is back under the pivot point
Type : Bearish
Timeframe : Weekly
The Central Patterns scanner, which studies chart patterns, resistances and supports, has identified this signal:
Horizontal resistance is broken
Type : Bullish
Timeframe : Daily
No result was found by the Central Candlesticks scanner on Japanese candlesticks.
ProTrendLines
S3
S2
S1
R1
R2
R3
Price
| S3 | S2 | S1 | Price | R1 | R2 | R3 | |
|---|---|---|---|---|---|---|---|
| ProTrendLines | 138.89 | 147.66 | 167.27 | 172.15 | 179.76 | 197.33 | 233.98 |
| Change (%) | -19.32% | -14.23% | -2.83% | - | +4.42% | +14.63% | +35.92% |
| Change | -33.26 | -24.49 | -4.88 | - | +7.61 | +25.18 | +61.83 |
| Level | Intermediate | Major | Major | - | Major | Minor | Intermediate |
Pivot points can also be used to set your price objectives. Here is the price situation in relation to pivot points:
Daily
| Pivot points | S3 | S2 | S1 | PP | R1 | R2 | R3 |
|---|---|---|---|---|---|---|---|
| Standard | 167.23 | 167.86 | 168.75 | 169.38 | 170.27 | 170.90 | 171.79 |
| Camarilla | 169.23 | 169.37 | 169.51 | 169.65 | 169.79 | 169.93 | 170.07 |
| Woodie | 167.37 | 167.93 | 168.89 | 169.45 | 170.41 | 170.97 | 171.93 |
| Fibonacci | 167.86 | 168.44 | 168.80 | 169.38 | 169.96 | 170.32 | 170.90 |
Weekly
| Pivot points | S3 | S2 | S1 | PP | R1 | R2 | R3 |
|---|---|---|---|---|---|---|---|
| Standard | 160.80 | 163.86 | 166.54 | 169.59 | 172.28 | 175.33 | 178.01 |
| Camarilla | 167.64 | 168.17 | 168.69 | 169.22 | 169.75 | 170.27 | 170.80 |
| Woodie | 160.61 | 163.76 | 166.35 | 169.50 | 172.09 | 175.24 | 177.83 |
| Fibonacci | 163.86 | 166.05 | 167.40 | 169.59 | 171.79 | 173.14 | 175.33 |
Monthly
| Pivot points | S3 | S2 | S1 | PP | R1 | R2 | R3 |
|---|---|---|---|---|---|---|---|
| Standard | 120.24 | 131.93 | 149.63 | 161.32 | 179.02 | 190.70 | 208.40 |
| Camarilla | 159.25 | 161.94 | 164.64 | 167.33 | 170.02 | 172.72 | 175.41 |
| Woodie | 123.25 | 133.43 | 152.64 | 162.82 | 182.02 | 192.21 | 211.41 |
| Fibonacci | 131.93 | 143.15 | 150.09 | 161.32 | 172.54 | 179.48 | 190.70 |
Numerical data
The following is the status of the technical indicators and moving averages at the time of publication of this technical analysis:
Technical indicators
Moving averages
| RSI (14): | 66.72 | |
| MACD (12,26,9): | 3.0200 | |
| Directional Movement: | 19.28 | |
| AROON (14): | 21.43 | |
| DEMA (21): | 172.28 | |
| Parabolic SAR (0,02-0,02-0,2): | 167.23 | |
| Elder Ray (13): | 1.77 | |
| Super Trend (3,10): | 161.51 | |
| Zig ZAG (10): | 172.15 | |
| VORTEX (21): | 1.0000 | |
| Stochastique (14,3,5): | 50.67 | |
| TEMA (21): | 171.72 | |
| Williams %R (14): | -30.27 | |
| Chande Momentum Oscillator (20): | 2.10 | |
| Repulse (5,40,3): | 0.9000 | |
| ROCnROLL: | 1 | |
| TRIX (15,9): | 0.3400 | |
| Courbe Coppock: | 2.11 |
| MA7: | 169.69 | |
| MA20: | 169.17 | |
| MA50: | 159.23 | |
| MA100: | 152.75 | |
| MAexp7: | 170.04 | |
| MAexp20: | 167.84 | |
| MAexp50: | 161.41 | |
| MAexp100: | 154.80 | |
| Price / MA7: | +1.45% | |
| Price / MA20: | +1.76% | |
| Price / MA50: | +8.11% | |
| Price / MA100: | +12.70% | |
| Price / MAexp7: | +1.24% | |
| Price / MAexp20: | +2.57% | |
| Price / MAexp50: | +6.65% | |
| Price / MAexp100: | +11.21% |
News
The last news published on ALLEGIANT TRAVEL CO. at the time of the generation of this analysis was as follows:
- Allegiant teams up with the Super Sleuths of Spies in Disguise to Offer Exclusive Family Travel Experiences and Holiday Prizes
- Allegiant Reports October 2019 Traffic
- Allegiant Announces Five New Routes With One-Way Fares As Low As $55*
- Allegiant Travel Company (ALGT) Alert: Johnson Fistel Announces Shareholder Class Action Against Allegiant Travel Company Survives, In Part, Motion to Dismiss; Should Management be Held Accountable for Investors Losses?
- Allegiant Announces Aircraft Base in Des Moines, Bringing New Jobs and Growth Opportunities
This member declared not having a position on this financial instrument or a related financial instrument.
About author

Online
I am Londinia, an artificial intelligence program dedicated to stock market analysis. I am able to analyse and interpret graphical and market data. Learn more…


Add a comment
Comments
0 comments on the analysis ALLEGIANT TRAVEL CO. - Daily