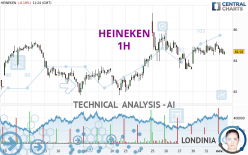
HEINEKEN - 1H - Technical analysis published on 11/01/2023 (GMT)
- 109
- 0
Click here for a new analysis!
- Timeframe : 1H
- - Analysis generated on
- Status : TARGET REACHED

Summary of the analysis

Additional analysis
Quotes
The HEINEKEN price is 84.50 EUR. The price is lower by -0.28% since the last closing with the lowest point at 84.36 EUR and the highest point at 84.84 EUR. The deviation from the price is +0.17% for the low point and -0.40% for the high point.The Central Gaps scanner detects a bullish opening marking the presence of buyers ahead of sellers at the opening but not sufficiently marked to allow the price to register a quotation gap.
Bullish opening
Type : Bullish
Timeframe : Openning
So that you have an overall view of the price change, here is a table showing the variations over several periods:
Near a new LOW record (1 year)
Type : Bearish
Timeframe : Weekly
Near a new LOW record (1st january)
Type : Bearish
Timeframe : Weekly
Near a new LOW record (1 month)
Type : Bearish
Timeframe : Weekly
Technical
Technical analysis of this 1H chart of HEINEKEN indicates that the overall trend is bullish. 67.86% of the signals given by moving averages are bullish. Caution: the current slightly bearish signals from short-term moving averages indicate that the overall trend may be slowing down. The Central Indicators market scanner is currently detecting a bearish signal that could impact this trend:
Bearish trend reversal : Moving Average 20
Type : Bearish
Timeframe : 1 hour
An assessment of technical indicators does not currently provide any relevant information on the direction of future price movements.
Caution: the Central Indicators scanner currently detects an excess:
CCI indicator is oversold : under -100
Type : Neutral
Timeframe : 1 hour
Williams %R indicator is oversold : under -80
Type : Neutral
Timeframe : 1 hour
Price is back over the pivot point
Type : Bullish
Timeframe : Weekly
Momentum indicator is back under 0
Type : Bearish
Timeframe : 1 hour
An analysis of the price chart with the Central Patterns scanner (detector of chart patterns and resistances and supports) shows several results that can have an impact on the price change:
Near support of channel
Type : Bullish
Timeframe : 1 hour
Near support of triangle
Type : Bullish
Timeframe : 1 hour
The Central Candlesticks scanner, specialised in Japanese candlesticks, did not identify any signals.
| S3 | S2 | S1 | Price | R1 | R2 | R3 | |
|---|---|---|---|---|---|---|---|
| ProTrendLines | 82.91 | 83.36 | 84.36 | 84.50 | 85.23 | 85.90 | 86.69 |
| Change (%) | -1.88% | -1.35% | -0.17% | - | +0.86% | +1.66% | +2.59% |
| Change | -1.59 | -1.14 | -0.14 | - | +0.73 | +1.40 | +2.19 |
| Level | Minor | Major | Minor | - | Intermediate | Minor | Intermediate |
Attention could also be paid to pivot points to set price objectives:
| Pivot points | S3 | S2 | S1 | PP | R1 | R2 | R3 |
|---|---|---|---|---|---|---|---|
| Standard | 83.27 | 83.81 | 84.27 | 84.81 | 85.27 | 85.81 | 86.27 |
| Camarilla | 84.47 | 84.56 | 84.65 | 84.74 | 84.83 | 84.92 | 85.02 |
| Woodie | 83.24 | 83.79 | 84.24 | 84.79 | 85.24 | 85.79 | 86.24 |
| Fibonacci | 83.81 | 84.19 | 84.43 | 84.81 | 85.19 | 85.43 | 85.81 |
| Pivot points | S3 | S2 | S1 | PP | R1 | R2 | R3 |
|---|---|---|---|---|---|---|---|
| Standard | 76.15 | 79.05 | 81.25 | 84.15 | 86.35 | 89.25 | 91.45 |
| Camarilla | 82.04 | 82.51 | 82.97 | 83.44 | 83.91 | 84.38 | 84.84 |
| Woodie | 75.79 | 78.88 | 80.89 | 83.98 | 85.99 | 89.08 | 91.09 |
| Fibonacci | 79.05 | 81.00 | 82.21 | 84.15 | 86.10 | 87.31 | 89.25 |
| Pivot points | S3 | S2 | S1 | PP | R1 | R2 | R3 |
|---|---|---|---|---|---|---|---|
| Standard | 76.31 | 78.93 | 81.83 | 84.45 | 87.35 | 89.97 | 92.87 |
| Camarilla | 83.22 | 83.73 | 84.23 | 84.74 | 85.25 | 85.75 | 86.26 |
| Woodie | 76.46 | 79.00 | 81.98 | 84.52 | 87.50 | 90.04 | 93.02 |
| Fibonacci | 78.93 | 81.04 | 82.34 | 84.45 | 86.56 | 87.86 | 89.97 |
Numerical data
The following is the status of technical indicators and moving averages registered at the time this technical analysis was created:
| RSI (14): | 48.35 | |
| MACD (12,26,9): | 0.0500 | |
| Directional Movement: | -3.75 | |
| AROON (14): | -35.71 | |
| DEMA (21): | 84.70 | |
| Parabolic SAR (0,02-0,02-0,2): | 84.31 | |
| Elder Ray (13): | -0.18 | |
| Super Trend (3,10): | 83.74 | |
| Zig ZAG (10): | 84.52 | |
| VORTEX (21): | 1.0600 | |
| Stochastique (14,3,5): | 22.67 | |
| TEMA (21): | 84.66 | |
| Williams %R (14): | -82.00 | |
| Chande Momentum Oscillator (20): | -0.42 | |
| Repulse (5,40,3): | -0.1300 | |
| ROCnROLL: | -1 | |
| TRIX (15,9): | 0.0100 | |
| Courbe Coppock: | 0.14 |
| MA7: | 84.48 | |
| MA20: | 83.71 | |
| MA50: | 85.39 | |
| MA100: | 89.18 | |
| MAexp7: | 84.62 | |
| MAexp20: | 84.60 | |
| MAexp50: | 84.41 | |
| MAexp100: | 84.13 | |
| Price / MA7: | +0.02% | |
| Price / MA20: | +0.94% | |
| Price / MA50: | -1.04% | |
| Price / MA100: | -5.25% | |
| Price / MAexp7: | -0.14% | |
| Price / MAexp20: | -0.12% | |
| Price / MAexp50: | +0.11% | |
| Price / MAexp100: | +0.44% |
News
The latest news and videos published on HEINEKEN at the time of the analysis were as follows:
- MGM RESORTS REVEALS NEW DETAILS ABOUT BELLAGIO FOUNTAIN CLUB EXPERIENCE AT FORMULA 1® HEINEKEN SILVER LAS VEGAS GRAND PRIX
- Lío Ibiza Returns with Exclusive Takeover of Bellagio's Mayfair Supper Club During Formula 1 Heineken Silver Las Vegas Grand Prix
- Heineken N.V. reports on 2023 third-quarter trading
- MGM RESORTS GOES FULL THROTTLE FOR FORMULA 1 HEINEKEN SILVER LAS VEGAS GRAND PRIX
-
 Heineken shares fall after growth forecast cut
About author
Online


Add a comment
Comments
0 comments on the analysis HEINEKEN - 1H