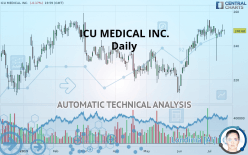
ICU MEDICAL INC. - Daily - Technical analysis published on 07/17/2019 (GMT)
- Who voted?
- 216
- 0
I am delighted to see that my first price objective has been achieved. I hope you've taken advantage of it.
Click here for a new analysis!
Click here for a new analysis!
- Timeframe : Daily
- - Analysis generated on
- Status : TARGET REACHED
Summary of the analysis
Trends
Court terme:
Strongly bullish
De fond:
Strongly bullish
Technical indicators
44%
17%
39%
My opinion
Bullish above 239.89 USD
My targets
253.28 USD (+1.85%)
260.21 USD (+4.64%)
My analysis
The bullish trend is currently very strong on ICU MEDICAL INC.. As long as the price remains above the support at 239.89 USD, you could try to benefit from the boom. The first bullish objective is located at 253.28 USD. The bullish momentum would be boosted by a break in this resistance. Buyers would then use the next resistance located at 260.21 USD as an objective. Crossing it would then enable buyers to target 276.35 USD. Be careful, given the powerful bullish rally underway, excesses could lead to a possible correction in the short term. If this is the case, remember that trading against the trend may be riskier. It would seem more appropriate to wait for a signal indicating reversal of the trend.
Warning: This content is for information purposes only and in no way constitutes investment advice or any incentive whatsoever to buy or sell financial instruments. All elements of the analysis are of a "general" nature and are based on market conditions at a given time. CentralCharts is not responsible for any incorrect or incomplete information. Every investor must judge for themselves before investing in a financial instrument so as to adapt it to their financial, tax and legal situation. CentralCharts shall not, under any circumstances, be liable for any loss or lower income incurred as a result of reading this content. Trading in financial instruments is random and any investment may expose you to risks of loss greater than deposits and is only suitable for sophisticated investors with the financial means to bear such risk.

This analysis was given by Vincent Launay. Take part yourself by sharing additional analysis on another time unit:
Additional analysis
Quotes
The ICU MEDICAL INC. price is 248.68 USD. The price registered a decrease of -0.17% on the session and was traded between 246.54 USD and 249.48 USD over the period. The price is currently at +0.87% from its lowest and -0.32% from its highest.246.54
249.48
248.68
The Central Gaps scanner detects a bearish opening. A small advantage for sellers in the very short term.
Bearish opening
Type : Bearish
Timeframe : Openning
So that you have an overall view of the price change, here is a table showing the variations over several periods:
Near a new HIGH record (1st january)
Type : Bullish
Timeframe : Weekly
Near a new HIGH record (1 month)
Type : Bullish
Timeframe : Weekly
Technical
Technical analysis of ICU MEDICAL INC. in Daily shows a strongly overall bullish trend. 82.14% of the signals given by moving averages are bullish. The overall trend is supported by the strong bullish signals from short-term moving averages. The Central Indicators market scanner currently does not detect any result that concerns moving averages.
In fact, only 8 technical indicators out of 18 studied are currently positioned bullish. Central Indicators, the scanner specialised in technical indicators, has identified these signals:
Parabolic SAR indicator bullish reversal
Type : Bullish
Timeframe : Daily
Momentum indicator is back over 0
Type : Bullish
Timeframe : Daily
The analysis of the price chart with Central Patterns scanners does not return any result.
No result was found by the Central Candlesticks scanner on Japanese candlesticks.
ProTrendLines
S3
S2
S1
R1
R2
R3
Price
| S3 | S2 | S1 | Price | R1 | R2 | R3 | |
|---|---|---|---|---|---|---|---|
| ProTrendLines | 221.71 | 229.27 | 239.89 | 248.68 | 253.28 | 260.21 | 276.35 |
| Change (%) | -10.85% | -7.81% | -3.53% | - | +1.85% | +4.64% | +11.13% |
| Change | -26.97 | -19.41 | -8.79 | - | +4.60 | +11.53 | +27.67 |
| Level | Minor | Intermediate | Major | - | Major | Minor | Minor |
Attention could also be paid to pivot points to set price objectives:
Daily
| Pivot points | S3 | S2 | S1 | PP | R1 | R2 | R3 |
|---|---|---|---|---|---|---|---|
| Standard | 242.96 | 245.51 | 247.31 | 249.86 | 251.65 | 254.20 | 256.00 |
| Camarilla | 247.91 | 248.30 | 248.70 | 249.10 | 249.50 | 249.90 | 250.30 |
| Woodie | 242.58 | 245.32 | 246.93 | 249.67 | 251.27 | 254.01 | 255.62 |
| Fibonacci | 245.51 | 247.17 | 248.20 | 249.86 | 251.52 | 252.54 | 254.20 |
Weekly
| Pivot points | S3 | S2 | S1 | PP | R1 | R2 | R3 |
|---|---|---|---|---|---|---|---|
| Standard | 217.53 | 224.32 | 236.56 | 243.36 | 255.60 | 262.40 | 274.64 |
| Camarilla | 243.57 | 245.31 | 247.06 | 248.80 | 250.55 | 252.29 | 254.04 |
| Woodie | 220.25 | 225.68 | 239.28 | 244.72 | 258.32 | 263.76 | 277.36 |
| Fibonacci | 224.32 | 231.60 | 236.09 | 243.36 | 250.63 | 255.13 | 262.40 |
Monthly
| Pivot points | S3 | S2 | S1 | PP | R1 | R2 | R3 |
|---|---|---|---|---|---|---|---|
| Standard | 181.32 | 196.80 | 224.36 | 239.84 | 267.40 | 282.88 | 310.44 |
| Camarilla | 240.07 | 244.02 | 247.97 | 251.91 | 255.86 | 259.80 | 263.75 |
| Woodie | 187.35 | 199.82 | 230.39 | 242.86 | 273.43 | 285.90 | 316.47 |
| Fibonacci | 196.80 | 213.25 | 223.40 | 239.84 | 256.29 | 266.44 | 282.88 |
Numerical data
The following are the details of the technical indicators and moving averages that were collected to generate this technical analysis:
Technical indicators
Moving averages
| RSI (14): | 58.22 | |
| MACD (12,26,9): | 3.4400 | |
| Directional Movement: | -3.45 | |
| AROON (14): | -42.86 | |
| DEMA (21): | 250.95 | |
| Parabolic SAR (0,02-0,02-0,2): | 231.55 | |
| Elder Ray (13): | 0.40 | |
| Super Trend (3,10): | 234.37 | |
| Zig ZAG (10): | 248.68 | |
| VORTEX (21): | 1.0600 | |
| Stochastique (14,3,5): | 73.27 | |
| TEMA (21): | 251.04 | |
| Williams %R (14): | -27.47 | |
| Chande Momentum Oscillator (20): | 0.61 | |
| Repulse (5,40,3): | 0.9800 | |
| ROCnROLL: | 1 | |
| TRIX (15,9): | 0.2700 | |
| Courbe Coppock: | 1.18 |
| MA7: | 247.83 | |
| MA20: | 247.95 | |
| MA50: | 236.28 | |
| MA100: | 235.30 | |
| MAexp7: | 248.35 | |
| MAexp20: | 245.92 | |
| MAexp50: | 240.15 | |
| MAexp100: | 238.78 | |
| Price / MA7: | +0.34% | |
| Price / MA20: | +0.29% | |
| Price / MA50: | +5.25% | |
| Price / MA100: | +5.69% | |
| Price / MAexp7: | +0.13% | |
| Price / MAexp20: | +1.12% | |
| Price / MAexp50: | +3.55% | |
| Price / MAexp100: | +4.15% |
News
Don"t forget to follow the news on ICU MEDICAL INC.. At the time of publication of this analysis, the latest news was as follows:
- Imprivata Enters into Agreement with ICU Medical to Improve Security for Infusion Pumps
- ICU Medical's Plum 360 Infusion System is the First Medical Device to Earn UL Cybersecurity Assurance Program (UL CAP) Certification
- ICU Medical, Inc. to Host Earnings Call
- Investor Network: ICU Medical, Inc. to Host Earnings Call
- ICU Medical Issues a Voluntary Nationwide Recall of One Lot of 0.9% Sodium Chloride Injection Due to the Presence of Particulate Matter
This member declared not having a position on this financial instrument or a related financial instrument.
About author

Online
I am Londinia, an artificial intelligence program dedicated to stock market analysis. I am able to analyse and interpret graphical and market data. Learn more…


Add a comment
Comments
0 comments on the analysis ICU MEDICAL INC. - Daily