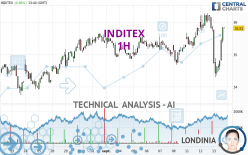
INDITEX - 1H - Technical analysis published on 09/13/2023 (GMT)
- 130
- 0
Click here for a new analysis!
- Timeframe : 1H
- - Analysis generated on
- Status : TARGET REACHED

Summary of the analysis

Additional analysis
Quotes
The INDITEX rating is 35.75 EUR. The price registered a decrease of -0.11% on the session with the lowest point at 34.30 EUR and the highest point at 35.76 EUR. The deviation from the price is +4.23% for the low point and -0.03% for the high point.A bearish opening was detected by the Central Gaps scanner. Sellers are trying to impose a bearish trend in the very short term.
Bearish opening
Type : Bearish
Timeframe : Openning
A study of price movements over other periods shows the following variations:
New HIGH record (5 years)
Type : Bullish
Timeframe : Weekly
Near a new HIGH record (1 year)
Type : Bullish
Timeframe : Weekly
Near a new HIGH record (1st january)
Type : Bullish
Timeframe : Weekly
Near a new LOW record (1 month)
Type : Bearish
Timeframe : Weekly
Technical
Technical analysis of this 1H chart of INDITEX indicates that the overall trend is strongly bullish. 85.71% of the signals given by moving averages are bullish. The slightly bullish signals given by the short-term moving averages show a weakening of the global trend. The Central Indicators scanner detects bullish signals on moving averages that could impact this trend:
Bullish trend reversal : Moving Average 20
Type : Bullish
Timeframe : 1 hour
Bullish trend reversal : Moving Average 50
Type : Bullish
Timeframe : 1 hour
Bullish trend reversal : Moving Average 100
Type : Bullish
Timeframe : 1 hour
Bullish trend reversal : adaptative moving average 20
Type : Bullish
Timeframe : 1 hour
Bullish trend reversal : adaptative moving average 50
Type : Bullish
Timeframe : 1 hour
Bullish trend reversal : adaptative moving average 100
Type : Bullish
Timeframe : 1 hour
Bullish price crossover with Moving Average 20
Type : Bullish
Timeframe : 1 hour
Bullish price crossover with adaptative moving average 20
Type : Bullish
Timeframe : 1 hour
The technical indicators are generally neutral. They do not provide relevant information on the direction of future price movements.
Other results related to technical indicators were also found by the Central Indicators scanner:
Parabolic SAR indicator bullish reversal
Type : Bullish
Timeframe : 1 hour
SuperTrend indicator bullish reversal
Type : Bullish
Timeframe : 1 hour
Central Patterns, the market scanner focusing on chart patterns, resistances and supports found these results:
Near horizontal support
Type : Bullish
Timeframe : 1 hour
Support of channel is broken
Type : Bearish
Timeframe : 1 hour
The Central Candlesticks scanner, specialised in Japanese candlesticks, did not identify any signals.
| S3 | S2 | S1 | Price | |
|---|---|---|---|---|
| ProTrendLines | 33.73 | 34.86 | 35.46 | 35.75 |
| Change (%) | -5.65% | -2.49% | -0.81% | - |
| Change | -2.02 | -0.89 | -0.29 | - |
| Level | Intermediate | Intermediate | Major | - |
To determine price objectives, it is also possible to use the pivot points. Here is the price position in relation to pivot points:
| Pivot points | S3 | S2 | S1 | PP | R1 | R2 | R3 |
|---|---|---|---|---|---|---|---|
| Standard | 35.00 | 35.36 | 35.57 | 35.93 | 36.14 | 36.50 | 36.71 |
| Camarilla | 35.63 | 35.69 | 35.74 | 35.79 | 35.84 | 35.90 | 35.95 |
| Woodie | 34.94 | 35.32 | 35.51 | 35.89 | 36.08 | 36.46 | 36.65 |
| Fibonacci | 35.36 | 35.57 | 35.71 | 35.93 | 36.14 | 36.28 | 36.50 |
| Pivot points | S3 | S2 | S1 | PP | R1 | R2 | R3 |
|---|---|---|---|---|---|---|---|
| Standard | 33.93 | 34.30 | 34.80 | 35.17 | 35.67 | 36.04 | 36.54 |
| Camarilla | 35.05 | 35.13 | 35.21 | 35.29 | 35.37 | 35.45 | 35.53 |
| Woodie | 33.99 | 34.33 | 34.86 | 35.20 | 35.73 | 36.07 | 36.60 |
| Fibonacci | 34.30 | 34.64 | 34.84 | 35.17 | 35.51 | 35.71 | 36.04 |
| Pivot points | S3 | S2 | S1 | PP | R1 | R2 | R3 |
|---|---|---|---|---|---|---|---|
| Standard | 30.93 | 31.94 | 33.65 | 34.66 | 36.37 | 37.38 | 39.09 |
| Camarilla | 34.61 | 34.86 | 35.11 | 35.36 | 35.61 | 35.86 | 36.11 |
| Woodie | 31.28 | 32.12 | 34.00 | 34.84 | 36.72 | 37.56 | 39.44 |
| Fibonacci | 31.94 | 32.98 | 33.62 | 34.66 | 35.70 | 36.34 | 37.38 |
Numerical data
The following is the status of the technical indicators and moving averages at the time of publication of this technical analysis:
| RSI (14): | 54.48 | |
| MACD (12,26,9): | -0.0900 | |
| Directional Movement: | 4.98 | |
| AROON (14): | -35.72 | |
| DEMA (21): | 35.28 | |
| Parabolic SAR (0,02-0,02-0,2): | 34.30 | |
| Elder Ray (13): | 0.19 | |
| Super Trend (3,10): | 34.40 | |
| Zig ZAG (10): | 35.62 | |
| VORTEX (21): | 1.0000 | |
| Stochastique (14,3,5): | 49.66 | |
| TEMA (21): | 35.13 | |
| Williams %R (14): | -34.85 | |
| Chande Momentum Oscillator (20): | -0.61 | |
| Repulse (5,40,3): | 2.2200 | |
| ROCnROLL: | 1 | |
| TRIX (15,9): | -0.0100 | |
| Courbe Coppock: | 4.01 |
| MA7: | 35.47 | |
| MA20: | 34.90 | |
| MA50: | 34.46 | |
| MA100: | 33.52 | |
| MAexp7: | 35.22 | |
| MAexp20: | 35.35 | |
| MAexp50: | 35.35 | |
| MAexp100: | 35.18 | |
| Price / MA7: | +0.79% | |
| Price / MA20: | +2.44% | |
| Price / MA50: | +3.74% | |
| Price / MA100: | +6.65% | |
| Price / MAexp7: | +1.50% | |
| Price / MAexp20: | +1.13% | |
| Price / MAexp50: | +1.13% | |
| Price / MAexp100: | +1.62% |
News
The latest news and videos published on INDITEX at the time of the analysis were as follows:
- Apranga Group extends successful collaboration with Inditex
- Apranga Group extends successful collaboration with Inditex
-
 UK GDP latest, Poland's Duda visits Washington, Inditex results
-
Key Brexit votes, energy leaders' shale focus, Inditex reports
-
Brexit deal vote, ECB meeting, Inditex results
About author
Online


Add a comment
Comments
0 comments on the analysis INDITEX - 1H