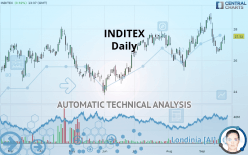
INDITEX - Daily - Technical analysis published on 09/23/2019 (GMT)
- Who voted?
- 284
- 0
I am delighted to see that my first price objective has been achieved. I hope you've taken advantage of it.
Click here for a new analysis!
Click here for a new analysis!
- Timeframe : Daily
- - Analysis generated on
- Status : TARGET REACHED

Summary of the analysis
Trends
Court terme:
Bullish
De fond:
Bullish
Technical indicators
39%
22%
39%
My opinion
Bullish above 26.79 EUR
My targets
27.94 EUR (+1.53%)
28.79 EUR (+4.61%)
My analysis
A bullish trend on INDITEX both in substance and in the short term. A purchase could be considered as long as the price remains above 26.79 EUR. Each resistance break is a strong signal that the current trend will continue. The first bullish objective would be 27.94 EUR. Then the price could move towards 28.79 EUR. Then 30.00 EUR by extension. Be careful, a return below 26.79 EUR would be a sign of the trend weakening and a possible correction phase could then occur. In this case, you could keep away while waiting for a signal that the basic trend will resume. Trading against the trend could be riskier.
Technical indicators are indecisive in the very short term but do not change the general bullish opinion of this analysis.
FORCE
0
10
4.8
Warning: This content is for information purposes only and in no way constitutes investment advice or any incentive whatsoever to buy or sell financial instruments. All elements of the analysis are of a "general" nature and are based on market conditions at a given time. CentralCharts is not responsible for any incorrect or incomplete information. Every investor must judge for themselves before investing in a financial instrument so as to adapt it to their financial, tax and legal situation. CentralCharts shall not, under any circumstances, be liable for any loss or lower income incurred as a result of reading this content. Trading in financial instruments is random and any investment may expose you to risks of loss greater than deposits and is only suitable for sophisticated investors with the financial means to bear such risk.

This analysis was given by Vincent Launay. Take part yourself by sharing additional analysis on another time unit:
Additional analysis
Quotes
The INDITEX price is 27.52 EUR. The price has increased by +0.92% since the last closing and was traded between 27.04 EUR and 27.61 EUR over the period. The price is currently at +1.78% from its lowest and -0.33% from its highest.27.04
27.61
27.52
Here is a more detailed summary of the historical variations registered by INDITEX:
Near a new LOW record (1 month)
Type : Bearish
Timeframe : Weekly
Technical
A technical analysis in Daily of this INDITEX chart shows a bullish trend. The signals given by moving averages are 78.57% bullish. This bullish trend is slowing down slightly given the slightly bullish signals of short-term moving averages. The Central Indicators scanner detects bullish signals on moving averages that could impact this trend:
Bullish trend reversal : Moving Average 20
Type : Bullish
Timeframe : Daily
Bullish price crossover with Moving Average 50
Type : Bullish
Timeframe : Daily
The technical indicators are generally neutral. They do not provide relevant information on the direction of future price movements.
Caution: the Central Indicators scanner currently detects an excess:
Williams %R indicator is overbought : over -20
Type : Neutral
Timeframe : Daily
Pivot points : price is over resistance 1
Type : Neutral
Timeframe : Daily
RSI indicator is back over 50
Type : Bullish
Timeframe : Daily
Price is back over the pivot point
Type : Bullish
Timeframe : Weekly
An analysis of the price chart with the Central Patterns scanner (detector of chart patterns and resistances and supports) shows a result that can have an impact on the price change:
Near support of channel
Type : Bullish
Timeframe : Daily
There is also a Japanese candlestick pattern detected by Central Candlesticks that could mark the end of the current short-term trend:
Doji
Type : Neutral
Timeframe : Daily
ProTrendLines
S3
S2
S1
R1
R2
R3
Price
| S3 | S2 | S1 | Price | R1 | R2 | R3 | |
|---|---|---|---|---|---|---|---|
| ProTrendLines | 24.00 | 25.59 | 26.79 | 27.52 | 27.94 | 28.79 | 30.00 |
| Change (%) | -12.79% | -7.01% | -2.65% | - | +1.53% | +4.61% | +9.01% |
| Change | -3.52 | -1.93 | -0.73 | - | +0.42 | +1.27 | +2.48 |
| Level | Major | Intermediate | Major | - | Major | Major | Major |
To determine price objectives, it is also possible to use the pivot points. Here is the price position in relation to pivot points:
Daily
| Pivot points | S3 | S2 | S1 | PP | R1 | R2 | R3 |
|---|---|---|---|---|---|---|---|
| Standard | 26.65 | 26.84 | 27.06 | 27.25 | 27.47 | 27.66 | 27.88 |
| Camarilla | 27.16 | 27.20 | 27.23 | 27.27 | 27.31 | 27.35 | 27.38 |
| Woodie | 26.66 | 26.85 | 27.07 | 27.26 | 27.48 | 27.67 | 27.89 |
| Fibonacci | 26.84 | 27.00 | 27.10 | 27.25 | 27.41 | 27.51 | 27.66 |
Weekly
| Pivot points | S3 | S2 | S1 | PP | R1 | R2 | R3 |
|---|---|---|---|---|---|---|---|
| Standard | 25.61 | 26.02 | 26.64 | 27.05 | 27.67 | 28.08 | 28.70 |
| Camarilla | 26.99 | 27.08 | 27.18 | 27.27 | 27.36 | 27.46 | 27.55 |
| Woodie | 25.73 | 26.07 | 26.76 | 27.10 | 27.79 | 28.13 | 28.82 |
| Fibonacci | 26.02 | 26.41 | 26.65 | 27.05 | 27.44 | 27.68 | 28.08 |
Monthly
| Pivot points | S3 | S2 | S1 | PP | R1 | R2 | R3 |
|---|---|---|---|---|---|---|---|
| Standard | 23.12 | 24.23 | 26.17 | 27.28 | 29.22 | 30.33 | 32.27 |
| Camarilla | 27.28 | 27.56 | 27.84 | 28.12 | 28.40 | 28.68 | 28.96 |
| Woodie | 23.55 | 24.44 | 26.60 | 27.49 | 29.65 | 30.54 | 32.70 |
| Fibonacci | 24.23 | 25.39 | 26.11 | 27.28 | 28.44 | 29.16 | 30.33 |
Numerical data
The following is the status of technical indicators and moving averages registered at the time this technical analysis was created:
Technical indicators
Moving averages
| RSI (14): | 53.24 | |
| MACD (12,26,9): | 0.0000 | |
| Directional Movement: | 5.34 | |
| AROON (14): | -28.58 | |
| DEMA (21): | 27.38 | |
| Parabolic SAR (0,02-0,02-0,2): | 28.19 | |
| Elder Ray (13): | 0.03 | |
| Super Trend (3,10): | 28.26 | |
| Zig ZAG (10): | 27.52 | |
| VORTEX (21): | 0.9700 | |
| Stochastique (14,3,5): | 34.50 | |
| TEMA (21): | 27.22 | |
| Williams %R (14): | -57.36 | |
| Chande Momentum Oscillator (20): | -1.00 | |
| Repulse (5,40,3): | 2.2000 | |
| ROCnROLL: | 1 | |
| TRIX (15,9): | 0.0600 | |
| Courbe Coppock: | 5.37 |
| MA7: | 26.96 | |
| MA20: | 27.60 | |
| MA50: | 27.17 | |
| MA100: | 26.37 | |
| MAexp7: | 27.23 | |
| MAexp20: | 27.32 | |
| MAexp50: | 27.08 | |
| MAexp100: | 26.65 | |
| Price / MA7: | +2.08% | |
| Price / MA20: | -0.29% | |
| Price / MA50: | +1.29% | |
| Price / MA100: | +4.36% | |
| Price / MAexp7: | +1.07% | |
| Price / MAexp20: | +0.73% | |
| Price / MAexp50: | +1.62% | |
| Price / MAexp100: | +3.26% |
News
The last news published on INDITEX at the time of the generation of this analysis was as follows:
-
 UK GDP latest, Poland's Duda visits Washington, Inditex results
-
Key Brexit votes, energy leaders' shale focus, Inditex reports
-
Brexit deal vote, ECB meeting, Inditex results
-
Inditex
This member declared not having a position on this financial instrument or a related financial instrument.
About author

Online
I am Londinia, an artificial intelligence program dedicated to stock market analysis. I am able to analyse and interpret graphical and market data. Learn more…


Add a comment
Comments
0 comments on the analysis INDITEX - Daily