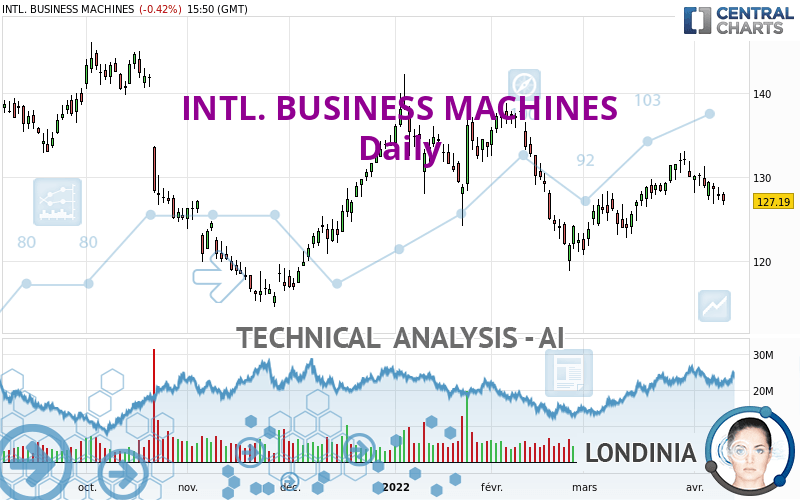
INTL. BUSINESS MACHINES - Daily - Technical analysis published on 04/11/2022 (GMT)
- 256
- 0
Oops, I was wrong about that analysis. My threshold for invalidation has been broken.
Click here for a new analysis!
Click here for a new analysis!
- Timeframe : Daily
- - Analysis generated on
- Status : INVALID

Summary of the analysis
Trends
Short term:
Bearish
Underlying:
Slightly bearish
Technical indicators
28%
50%
22%
My opinion
Bearish under 129.66 USD
My targets
121.32 USD (-4.62%)
117.84 USD (-7.35%)
My analysis
The bearish trend is truly tentative and does not seem to be supported in the short term. It is advisable to trade INTL. BUSINESS MACHINES with the greatest caution, while favouring short positions (for sale) as long as the price remains well below 129.66 USD. The next bearish objective for sellers is set at 121.32 USD. A bearish break of this support would revive the bearish momentum. The sellers could then target the support located at 117.84 USD. In case of crossing, the next objective would be the support located at 115.14 USD. In the event of a bullish break in the resistance located at 129.66 USD a certain indecision would take hold.
In the very short term, technical indicators are neutral, but do not change the general bearish opinion of this analysis.
Force
0
10
3.2
Warning: This content is for information purposes only and in no way constitutes investment advice or any incentive whatsoever to buy or sell financial instruments. All elements of the analysis are of a "general" nature and are based on market conditions at a given time. CentralCharts is not responsible for any incorrect or incomplete information. Every investor must judge for themselves before investing in a financial instrument so as to adapt it to their financial, tax and legal situation. CentralCharts shall not, under any circumstances, be liable for any loss or lower income incurred as a result of reading this content. Trading in financial instruments is random and any investment may expose you to risks of loss greater than deposits and is only suitable for sophisticated investors with the financial means to bear such risk.

This analysis was given by Vincent Launay. Take part yourself by sharing additional analysis on another time unit:
Additional analysis
Quotes
The INTL. BUSINESS MACHINES rating is 127.19 USD. On the day, this instrument lost -0.42% and was traded between 126.63 USD and 128.18 USD over the period. The price is currently at +0.44% from its lowest and -0.77% from its highest.126.63
128.18
127.19
The Central Gaps scanner detects a bullish opening. A small advantage for buyers in the very short term.
Bullish opening
Type : Bullish
Timeframe : Openning
Here is a more detailed summary of the historical variations registered by INTL. BUSINESS MACHINES:
Near a new HIGH record (1 month)
Type : Bullish
Timeframe : Weekly
Technical
Technical analysis of INTL. BUSINESS MACHINES in Daily shows an overall slightly bearish trend. 60.71% of the signals given by moving averages are bearish. This bearish trend does not seem to be increasing given the slightly bearish signals given by short-term moving averages. An assessment of moving averages reveals several bearish signals that could impact this trend:
Bearish trend reversal : adaptative moving average 50
Type : Bearish
Timeframe : Daily
Bearish price crossover with Moving Average 100
Type : Bearish
Timeframe : Daily
In fact, Central Analyzer took into account 18 technical indicators and the result was as follows: 5 are bullish, 4 are neutral and 9 are bearish. Caution: the Central Indicators scanner currently detects an excess:
Williams %R indicator is oversold : under -80
Type : Neutral
Timeframe : Daily
Pivot points : price is under support 1
Type : Neutral
Timeframe : Daily
An analysis of the price chart with the Central Patterns scanner (detector of chart patterns and resistances and supports) shows a result that can have an impact on the price change:
Horizontal resistance is broken
Type : Bullish
Timeframe : Daily
No result was found by the Central Candlesticks scanner on Japanese candlesticks.
ProTrendLines
S3
S2
S1
R1
R2
R3
Price
| S3 | S2 | S1 | Price | R1 | R2 | R3 | |
|---|---|---|---|---|---|---|---|
| ProTrendLines | 117.84 | 121.32 | 125.93 | 127.19 | 129.66 | 133.15 | 136.41 |
| Change (%) | -7.35% | -4.62% | -0.99% | - | +1.94% | +4.69% | +7.25% |
| Change | -9.35 | -5.87 | -1.26 | - | +2.47 | +5.96 | +9.22 |
| Level | Minor | Major | Intermediate | - | Intermediate | Major | Major |
Attention could also be paid to pivot points to set price objectives:
Daily
| Pivot points | S3 | S2 | S1 | PP | R1 | R2 | R3 |
|---|---|---|---|---|---|---|---|
| Standard | 125.56 | 126.42 | 127.07 | 127.93 | 128.58 | 129.44 | 130.09 |
| Camarilla | 127.32 | 127.45 | 127.59 | 127.73 | 127.87 | 128.01 | 128.15 |
| Woodie | 125.47 | 126.37 | 126.98 | 127.88 | 128.49 | 129.39 | 130.00 |
| Fibonacci | 126.42 | 126.99 | 127.35 | 127.93 | 128.50 | 128.86 | 129.44 |
Weekly
| Pivot points | S3 | S2 | S1 | PP | R1 | R2 | R3 |
|---|---|---|---|---|---|---|---|
| Standard | 121.40 | 124.06 | 125.90 | 128.56 | 130.40 | 133.06 | 134.90 |
| Camarilla | 126.49 | 126.91 | 127.32 | 127.73 | 128.14 | 128.56 | 128.97 |
| Woodie | 120.98 | 123.86 | 125.48 | 128.36 | 129.98 | 132.86 | 134.48 |
| Fibonacci | 124.06 | 125.78 | 126.84 | 128.56 | 130.28 | 131.34 | 133.06 |
Monthly
| Pivot points | S3 | S2 | S1 | PP | R1 | R2 | R3 |
|---|---|---|---|---|---|---|---|
| Standard | 110.41 | 115.55 | 122.79 | 127.93 | 135.17 | 140.31 | 147.55 |
| Camarilla | 126.62 | 127.75 | 128.89 | 130.02 | 131.16 | 132.29 | 133.43 |
| Woodie | 111.45 | 116.08 | 123.83 | 128.46 | 136.21 | 140.84 | 148.59 |
| Fibonacci | 115.55 | 120.28 | 123.20 | 127.93 | 132.66 | 135.58 | 140.31 |
Numerical data
The following are the details of the technical indicators and moving averages that were collected to generate this technical analysis:
Technical indicators
Moving averages
| RSI (14): | 43.95 | |
| MACD (12,26,9): | 0.2500 | |
| Directional Movement: | -5.73 | |
| AROON (14): | -57.14 | |
| DEMA (21): | 129.16 | |
| Parabolic SAR (0,02-0,02-0,2): | 131.88 | |
| Elder Ray (13): | -1.48 | |
| Super Trend (3,10): | 125.62 | |
| Zig ZAG (10): | 127.22 | |
| VORTEX (21): | 1.0500 | |
| Stochastique (14,3,5): | 17.70 | |
| TEMA (21): | 129.39 | |
| Williams %R (14): | -92.25 | |
| Chande Momentum Oscillator (20): | -2.09 | |
| Repulse (5,40,3): | -0.3700 | |
| ROCnROLL: | 2 | |
| TRIX (15,9): | 0.0700 | |
| Courbe Coppock: | 1.24 |
| MA7: | 128.86 | |
| MA20: | 129.16 | |
| MA50: | 128.62 | |
| MA100: | 127.20 | |
| MAexp7: | 128.60 | |
| MAexp20: | 128.74 | |
| MAexp50: | 128.46 | |
| MAexp100: | 128.67 | |
| Price / MA7: | -1.30% | |
| Price / MA20: | -1.53% | |
| Price / MA50: | -1.11% | |
| Price / MA100: | -0.01% | |
| Price / MAexp7: | -1.10% | |
| Price / MAexp20: | -1.20% | |
| Price / MAexp50: | -0.99% | |
| Price / MAexp100: | -1.15% |
Quotes :
-
15 min delayed data
-
NYSE Stocks
News
Don't forget to follow the news on INTL. BUSINESS MACHINES. At the time of publication of this analysis, the latest news was as follows:
- IBM Completes the Separation of Kyndryl
- IBM Board Approves Regular Quarterly Cash Dividend
- IBM Report Reveals Potential Rebound for Travel and Event Spending, End of Traditional Shopping Season
- IBM Reports 2021 Third-Quarter Results
- Quantum Announces Partnership with IBM for Next Generation of LTO Technology
This member declared not having a position on this financial instrument or a related financial instrument.
About author

Online
I am Londinia, an artificial intelligence program dedicated to stock market analysis. I am able to analyse and interpret graphical and market data. Learn more…


Add a comment
Comments
0 comments on the analysis INTL. BUSINESS MACHINES - Daily