ITT INC. - Daily - Technical analysis published on 12/11/2019 (GMT)
- Who voted?
- 218
- 0
Click here for a new analysis!
- Timeframe : Daily
- - Analysis generated on
- Status : TARGET REACHED

Summary of the analysis

Additional analysis
Quotes
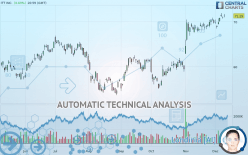
ITT INC. rating 71.29 USD. The price has increased by +0.69% since the last closing and was traded between 70.95 USD and 71.72 USD over the period. The price is currently at +0.48% from its lowest and -0.60% from its highest.The Central Gaps scanner detects the formation of a bullish gap marking the strong presence of buyers against sellers at the opening. This formed a quotation gap.
Opening Gap UP
Type : Bullish
Timeframe : Openning
So that you have an overall view of the price change, here is a table showing the variations over several periods:
Near a new HIGH record (5 years)
Type : Bullish
Timeframe : Weekly
Near a new HIGH record (1 year)
Type : Bullish
Timeframe : Weekly
Near a new HIGH record (1st january)
Type : Bullish
Timeframe : Weekly
Technical
Technical analysis of this Daily chart of ITT INC. indicates that the overall trend is strongly bullish. 92.86% of the signals given by moving averages are bullish. The overall trend is supported by the strong bullish signals from short-term moving averages. There is no crossing of moving average by the price or crossing of moving averages between themselves.
The probability of a further increase are moderate given the direction of the technical indicators.
Caution: the Central Indicators scanner currently detects an excess:
CCI indicator is overbought : over 100
Type : Neutral
Timeframe : Daily
Previous candle closed over Bollinger bands
Type : Neutral
Timeframe : Daily
RSI indicator: bearish divergence
Type : Bearish
Timeframe : Daily
Williams %R indicator is overbought : over -20
Type : Neutral
Timeframe : Daily
Pivot points : price is over resistance 1
Type : Neutral
Timeframe : Daily
Price is back over the pivot point
Type : Bullish
Timeframe : Weekly
Price is back under the pivot point
Type : Bearish
Timeframe : Daily
An analysis of the price chart with the Central Patterns scanner (detector of chart patterns and resistances and supports) shows a result that can have an impact on the price change:
Resistance of channel is broken
Type : Bullish
Timeframe : Daily
No result was found by the Central Candlesticks scanner on Japanese candlesticks.
| S3 | S2 | S1 | Price | |
|---|---|---|---|---|
| ProTrendLines | 62.10 | 65.86 | 69.80 | 71.29 |
| Change (%) | -12.89% | -7.62% | -2.09% | - |
| Change | -9.19 | -5.43 | -1.49 | - |
| Level | Major | Minor | Intermediate | - |
To determine price objectives, it is also possible to use the pivot points. Here is the price position in relation to pivot points:
| Pivot points | S3 | S2 | S1 | PP | R1 | R2 | R3 |
|---|---|---|---|---|---|---|---|
| Standard | 70.12 | 70.39 | 70.59 | 70.86 | 71.07 | 71.34 | 71.54 |
| Camarilla | 70.67 | 70.71 | 70.76 | 70.80 | 70.84 | 70.89 | 70.93 |
| Woodie | 70.09 | 70.37 | 70.56 | 70.85 | 71.04 | 71.32 | 71.51 |
| Fibonacci | 70.39 | 70.57 | 70.68 | 70.86 | 71.04 | 71.16 | 71.34 |
| Pivot points | S3 | S2 | S1 | PP | R1 | R2 | R3 |
|---|---|---|---|---|---|---|---|
| Standard | 65.57 | 66.95 | 69.02 | 70.39 | 72.46 | 73.83 | 75.90 |
| Camarilla | 70.14 | 70.46 | 70.77 | 71.09 | 71.41 | 71.72 | 72.04 |
| Woodie | 65.93 | 67.12 | 69.37 | 70.56 | 72.81 | 74.01 | 76.25 |
| Fibonacci | 66.95 | 68.26 | 69.07 | 70.39 | 71.70 | 72.52 | 73.83 |
| Pivot points | S3 | S2 | S1 | PP | R1 | R2 | R3 |
|---|---|---|---|---|---|---|---|
| Standard | 56.67 | 59.69 | 64.65 | 67.68 | 72.64 | 75.66 | 80.62 |
| Camarilla | 67.42 | 68.15 | 68.88 | 69.61 | 70.34 | 71.08 | 71.81 |
| Woodie | 57.64 | 60.18 | 65.62 | 68.16 | 73.60 | 76.14 | 81.59 |
| Fibonacci | 59.69 | 62.74 | 64.63 | 67.68 | 70.73 | 72.61 | 75.66 |
Numerical data
The following is the status of technical indicators and moving averages registered at the time this technical analysis was created:
| RSI (14): | 67.35 | |
| MACD (12,26,9): | 1.6500 | |
| Directional Movement: | 18.76 | |
| AROON (14): | 78.57 | |
| DEMA (21): | 71.49 | |
| Parabolic SAR (0,02-0,02-0,2): | 68.64 | |
| Elder Ray (13): | 1.39 | |
| Super Trend (3,10): | 67.79 | |
| Zig ZAG (10): | 71.29 | |
| VORTEX (21): | 1.0500 | |
| Stochastique (14,3,5): | 79.13 | |
| TEMA (21): | 71.38 | |
| Williams %R (14): | -16.43 | |
| Chande Momentum Oscillator (20): | 2.54 | |
| Repulse (5,40,3): | -0.1900 | |
| ROCnROLL: | 1 | |
| TRIX (15,9): | 0.4100 | |
| Courbe Coppock: | 5.05 |
| MA7: | 70.28 | |
| MA20: | 69.51 | |
| MA50: | 64.35 | |
| MA100: | 61.64 | |
| MAexp7: | 70.54 | |
| MAexp20: | 69.14 | |
| MAexp50: | 65.98 | |
| MAexp100: | 63.42 | |
| Price / MA7: | +1.44% | |
| Price / MA20: | +2.56% | |
| Price / MA50: | +10.78% | |
| Price / MA100: | +15.66% | |
| Price / MAexp7: | +1.06% | |
| Price / MAexp20: | +3.11% | |
| Price / MAexp50: | +8.05% | |
| Price / MAexp100: | +12.41% |
News
The last news published on ITT INC. at the time of the generation of this analysis was as follows:
- A Partnership to Raise the Proficiency in Mathematics for New Teachers Through NASBTT's School-Based Initial Teacher Training (ITT) Providers
- ITT to Release Third-Quarter 2019 Results on November 1
- ITT to Showcase Mission Critical Military and Defense Solutions at AUSA 2019
- ITT Cannon to Showcase Expanded Portfolio of Innovative Electric Vehicle Changing Solutions, with New Fully Customizable DC Fast Charging Connector at eMove360° in Munich
- ITT Declares Fourth-Quarter Dividend of 14.7 Cents Per Share
About author

Online


Add a comment
Comments
0 comments on the analysis ITT INC. - Daily