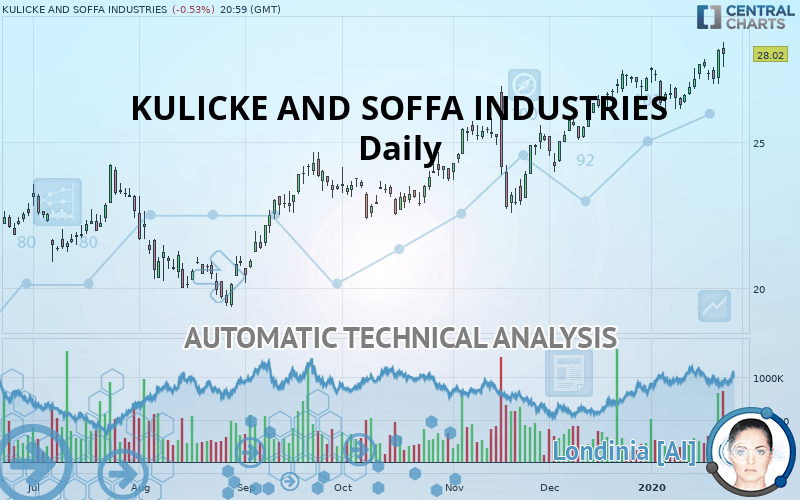
KULICKE AND SOFFA INDUSTRIES - Daily - Technical analysis published on 01/27/2020 (GMT)
- Who voted?
- 248
- 0
Click here for a new analysis!
- Timeframe : Daily
- - Analysis generated on
- Status : TARGET REACHED

Summary of the analysis

Additional analysis
Quotes
The KULICKE AND SOFFA INDUSTRIES rating is 28.02 USD. On the day, this instrument gained -0.53% and was traded between 27.60 USD and 28.45 USD over the period. The price is currently at +1.52% from its lowest and -1.51% from its highest.A bullish gap was detected at the opening by the Central Gaps scanner. There are a lot of buyers and they have the upper hand in the very short term.
Opening Gap UP
Type : Bullish
Timeframe : Openning
Here is a more detailed summary of the historical variations registered by KULICKE AND SOFFA INDUSTRIES:
New HIGH record (5 years)
Type : Bullish
Timeframe : Weekly
New HIGH record (1 year)
Type : Bullish
Timeframe : Weekly
New HIGH record (1st january)
Type : Bullish
Timeframe : Weekly
New HIGH record (1 month)
Type : Bullish
Timeframe : Weekly
Technical
A technical analysis in Daily of this KULICKE AND SOFFA INDUSTRIES chart shows a strongly bullish trend. 92.86% of the signals given by moving averages are bullish. This strongly bullish trend is supported by the strong bullish signals given by short-term moving averages. The Central Indicators scanner does not detect any result on moving averages that would impact this trend.
An assessment of technical indicators shows a moderate bullish signal.
Caution: the Central Indicators scanner currently detects an excess:
CCI indicator is overbought : over 100
Type : Neutral
Timeframe : Daily
MACD indicator: bullish divergence
Type : Bullish
Timeframe : Daily
Williams %R indicator is overbought : over -20
Type : Neutral
Timeframe : Daily
MACD crosses UP its Moving Average
Type : Bullish
Timeframe : Daily
Price is back over the pivot point
Type : Bullish
Timeframe : Daily
Price is back over the pivot point
Type : Bullish
Timeframe : Weekly
Momentum indicator is back over 0
Type : Bullish
Timeframe : Daily
An analysis of the price chart with the Central Patterns scanner (detector of chart patterns and resistances and supports) shows a result that can have an impact on the price change:
Near resistance of channel
Type : Bearish
Timeframe : Daily
No result was found by the Central Candlesticks scanner on Japanese candlesticks.
| S3 | S2 | S1 | Price | R1 | |
|---|---|---|---|---|---|
| ProTrendLines | 22.91 | 24.68 | 26.85 | 28.02 | 28.51 |
| Change (%) | -18.24% | -11.92% | -4.18% | - | +1.75% |
| Change | -5.11 | -3.34 | -1.17 | - | +0.49 |
| Level | Intermediate | Intermediate | Major | - | Major |
Pivot points can also be used to set your price objectives. Here is the price situation in relation to pivot points:
| Pivot points | S3 | S2 | S1 | PP | R1 | R2 | R3 |
|---|---|---|---|---|---|---|---|
| Standard | 26.22 | 26.62 | 27.40 | 27.80 | 28.58 | 28.98 | 29.76 |
| Camarilla | 27.85 | 27.96 | 28.07 | 28.18 | 28.28 | 28.39 | 28.50 |
| Woodie | 26.41 | 26.71 | 27.59 | 27.89 | 28.77 | 29.07 | 29.95 |
| Fibonacci | 26.62 | 27.07 | 27.35 | 27.80 | 28.25 | 28.53 | 28.98 |
| Pivot points | S3 | S2 | S1 | PP | R1 | R2 | R3 |
|---|---|---|---|---|---|---|---|
| Standard | 25.19 | 25.77 | 26.70 | 27.28 | 28.21 | 28.79 | 29.72 |
| Camarilla | 27.22 | 27.35 | 27.49 | 27.63 | 27.77 | 27.91 | 28.05 |
| Woodie | 25.37 | 25.86 | 26.88 | 27.37 | 28.39 | 28.88 | 29.90 |
| Fibonacci | 25.77 | 26.35 | 26.70 | 27.28 | 27.86 | 28.21 | 28.79 |
| Pivot points | S3 | S2 | S1 | PP | R1 | R2 | R3 |
|---|---|---|---|---|---|---|---|
| Standard | 21.46 | 22.67 | 24.94 | 26.15 | 28.41 | 29.62 | 31.89 |
| Camarilla | 26.24 | 26.56 | 26.88 | 27.20 | 27.52 | 27.84 | 28.16 |
| Woodie | 21.99 | 22.94 | 25.46 | 26.41 | 28.94 | 29.89 | 32.41 |
| Fibonacci | 22.67 | 24.00 | 24.82 | 26.15 | 27.48 | 28.30 | 29.62 |
Numerical data
The following is the status of the technical indicators and moving averages at the time of publication of this technical analysis:
| RSI (14): | 63.96 | |
| MACD (12,26,9): | 0.4800 | |
| Directional Movement: | 14.79 | |
| AROON (14): | 64.29 | |
| DEMA (21): | 27.74 | |
| Parabolic SAR (0,02-0,02-0,2): | 26.63 | |
| Elder Ray (13): | 0.69 | |
| Super Trend (3,10): | 26.18 | |
| Zig ZAG (10): | 28.02 | |
| VORTEX (21): | 1.0600 | |
| Stochastique (14,3,5): | 80.51 | |
| TEMA (21): | 27.75 | |
| Williams %R (14): | -18.53 | |
| Chande Momentum Oscillator (20): | 1.36 | |
| Repulse (5,40,3): | 2.5300 | |
| ROCnROLL: | 1 | |
| TRIX (15,9): | 0.2400 | |
| Courbe Coppock: | 3.77 |
| MA7: | 27.61 | |
| MA20: | 27.13 | |
| MA50: | 25.93 | |
| MA100: | 24.61 | |
| MAexp7: | 27.60 | |
| MAexp20: | 27.10 | |
| MAexp50: | 26.13 | |
| MAexp100: | 24.95 | |
| Price / MA7: | +1.48% | |
| Price / MA20: | +3.28% | |
| Price / MA50: | +8.06% | |
| Price / MA100: | +13.86% | |
| Price / MAexp7: | +1.52% | |
| Price / MAexp20: | +3.39% | |
| Price / MAexp50: | +7.23% | |
| Price / MAexp100: | +12.30% |
News
The last news published on KULICKE AND SOFFA INDUSTRIES at the time of the generation of this analysis was as follows:
- Kulicke & Soffa Schedules First Quarter 2020 Conference Call for 8AM EST, January 30th, 2020
- Kulicke & Soffa Declares Regular Quarterly Dividend of $0.12
- Kulicke & Soffa to Participate in SEMICON Taiwan 2019
- Kulicke & Soffa Research Collaboration with NUS Institute of Operations Research and Analytics Extends Smart Manufacturing Capabilities
- SHAREHOLDER ALERT - Bronstein, Gewirtz & Grossman, LLC Notifies Investors of Class Action Against Kulicke and Soffa Industries, Inc. (KLIC) & Lead Plaintiff Deadline - July 10, 2018
About author

Online


Add a comment
Comments
0 comments on the analysis KULICKE AND SOFFA INDUSTRIES - Daily