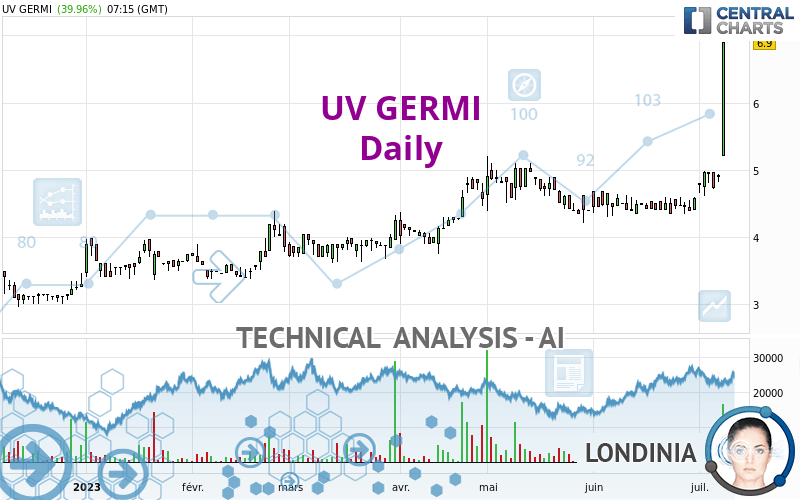
UV GERMI - Daily - Technical analysis published on 07/10/2023 (GMT)
- 99
- 0
Click here for a new analysis!
- Timeframe : Daily
- - Analysis generated on
- Status : LEVEL MAINTAINED

Summary of the analysis

Additional analysis
Quotes
The UV GERMI price is 6.90 EUR. The price has increased by +39.96% since the last closing with the lowest point at 5.20 EUR and the highest point at 6.90 EUR. The deviation from the price is +32.69% for the low point and 0% for the high point.The Central Gaps scanner detects the formation of a bullish gap marking the strong presence of buyers against sellers at the opening. This formed a quotation gap.
Opening Gap UP
Type : Bullish
Timeframe : Openning
Here is a more detailed summary of the historical variations registered by UV GERMI:
New HIGH record (1 year)
Type : Bullish
Timeframe : Weekly
New HIGH record (1st january)
Type : Bullish
Timeframe : Weekly
New HIGH record (1 month)
Type : Bullish
Timeframe : Weekly
Abnormal volumes on UV GERMI were detected by the Central Volumes scanner:
Abnormal volumes
Timeframe : 5 days
Technical
Technical analysis of this Daily chart of UV GERMI indicates that the overall trend is strongly bullish. The signals given by moving averages are 85.71% bullish. This strongly bullish trend seems to be running out of steam given the signals being given by short-term moving averages. The Central Indicators market scanner currently does not detect any result that concerns moving averages.
In fact, 16 technical indicators on 18 studied are currently positioned bullish. But beware of excesses. The Central Indicators scanner currently detects this:
RSI indicator is overbought : over 80
Type : Neutral
Timeframe : Daily
CCI indicator is overbought : over 100
Type : Neutral
Timeframe : Daily
Williams %R indicator is overbought : over -20
Type : Neutral
Timeframe : Daily
Pivot points : price is over resistance 3
Type : Neutral
Timeframe : Daily
Pivot points : price is over resistance 3
Type : Neutral
Timeframe : Weekly
An analysis of the price chart with the Central Patterns scanner (detector of chart patterns and resistances and supports) shows a result that can have an impact on the price change:
Near horizontal resistance
Type : Bearish
Timeframe : Daily
For a small rebound in the very short term, the Central Candlesticks scanner currently notes the presence of these bullish patterns in Japanese candlesticks:
Upside gap
Type : Bullish
Timeframe : Daily
White marubozu
Type : Bullish
Timeframe : Daily
Long white line
Type : Bullish
Timeframe : Daily
| S3 | S2 | S1 | Price | R1 | R2 | R3 | |
|---|---|---|---|---|---|---|---|
| ProTrendLines | 3.88 | 4.34 | 4.98 | 6.90 | 9.90 | 11.80 | 17.20 |
| Change (%) | -43.77% | -37.10% | -27.83% | - | +43.48% | +71.01% | +149.28% |
| Change | -3.02 | -2.56 | -1.92 | - | +3.00 | +4.90 | +10.30 |
| Level | Major | Intermediate | Intermediate | - | Minor | Minor | Major |
To determine price objectives, it is also possible to use the pivot points. Here is the price position in relation to pivot points:
| Pivot points | S3 | S2 | S1 | PP | R1 | R2 | R3 |
|---|---|---|---|---|---|---|---|
| Standard | 4.73 | 4.78 | 4.85 | 4.90 | 4.97 | 5.02 | 5.09 |
| Camarilla | 4.90 | 4.91 | 4.92 | 4.93 | 4.94 | 4.95 | 4.96 |
| Woodie | 4.75 | 4.79 | 4.87 | 4.91 | 4.99 | 5.03 | 5.11 |
| Fibonacci | 4.78 | 4.82 | 4.85 | 4.90 | 4.94 | 4.97 | 5.02 |
| Pivot points | S3 | S2 | S1 | PP | R1 | R2 | R3 |
|---|---|---|---|---|---|---|---|
| Standard | 4.33 | 4.47 | 4.70 | 4.84 | 5.07 | 5.21 | 5.44 |
| Camarilla | 4.83 | 4.86 | 4.90 | 4.93 | 4.96 | 5.00 | 5.03 |
| Woodie | 4.38 | 4.49 | 4.75 | 4.86 | 5.12 | 5.23 | 5.49 |
| Fibonacci | 4.47 | 4.61 | 4.70 | 4.84 | 4.98 | 5.07 | 5.21 |
| Pivot points | S3 | S2 | S1 | PP | R1 | R2 | R3 |
|---|---|---|---|---|---|---|---|
| Standard | 3.97 | 4.13 | 4.36 | 4.52 | 4.75 | 4.91 | 5.14 |
| Camarilla | 4.47 | 4.51 | 4.54 | 4.58 | 4.62 | 4.65 | 4.69 |
| Woodie | 4.00 | 4.15 | 4.39 | 4.54 | 4.78 | 4.93 | 5.17 |
| Fibonacci | 4.13 | 4.28 | 4.37 | 4.52 | 4.67 | 4.76 | 4.91 |
Numerical data
The following are the details of the technical indicators and moving averages that were collected to generate this technical analysis:
| RSI (14): | 79.73 | |
| MACD (12,26,9): | 0.2100 | |
| Directional Movement: | 48.17 | |
| AROON (14): | 78.57 | |
| DEMA (21): | 5.11 | |
| Parabolic SAR (0,02-0,02-0,2): | 4.53 | |
| Elder Ray (13): | 1.01 | |
| Super Trend (3,10): | 4.90 | |
| Zig ZAG (10): | 6.90 | |
| VORTEX (21): | 1.0300 | |
| Stochastique (14,3,5): | 84.38 | |
| TEMA (21): | 5.34 | |
| Williams %R (14): | 0.00 | |
| Chande Momentum Oscillator (20): | 2.40 | |
| Repulse (5,40,3): | 33.2300 | |
| ROCnROLL: | 1 | |
| TRIX (15,9): | 0.2100 | |
| Courbe Coppock: | 33.82 |
| MA7: | 5.12 | |
| MA20: | 4.64 | |
| MA50: | 4.64 | |
| MA100: | 4.33 | |
| MAexp7: | 5.31 | |
| MAexp20: | 4.78 | |
| MAexp50: | 4.58 | |
| MAexp100: | 4.39 | |
| Price / MA7: | +34.77% | |
| Price / MA20: | +48.71% | |
| Price / MA50: | +48.71% | |
| Price / MA100: | +59.35% | |
| Price / MAexp7: | +29.94% | |
| Price / MAexp20: | +44.35% | |
| Price / MAexp50: | +50.66% | |
| Price / MAexp100: | +57.18% |
News
The last news published on UV GERMI at the time of the generation of this analysis was as follows:
About author
Online


Add a comment
Comments
0 comments on the analysis UV GERMI - Daily