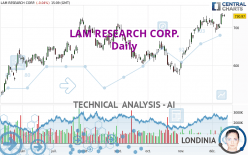
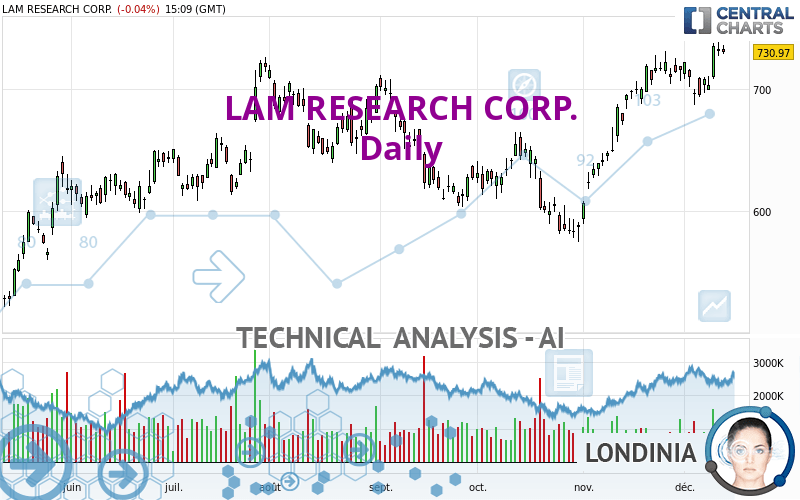
LAM RESEARCH CORP. - Daily - Technical analysis published on 12/13/2023 (GMT)
- 109
- 0
Click here for a new analysis!
- Timeframe : Daily
- - Analysis generated on
- Status : TARGET REACHED
Summary of the analysis

Additional analysis
Quotes
LAM RESEARCH CORP. rating 730.97 USD. The price is lower by -0.04% since the last closing and was traded between 729.24 USD and 736.44 USD over the period. The price is currently at +0.24% from its lowest and -0.74% from its highest.The Central Gaps scanner detects a bullish opening marking the presence of buyers ahead of sellers at the opening but not sufficiently marked to allow the price to register a quotation gap.
Bullish opening
Type : Bullish
Timeframe : Openning
Here is a more detailed summary of the historical variations registered by LAM RESEARCH CORP.:
New HIGH record (5 years)
Type : Bullish
Timeframe : Weekly
New HIGH record (1 year)
Type : Bullish
Timeframe : Weekly
New HIGH record (1st january)
Type : Bullish
Timeframe : Weekly
New HIGH record (1 month)
Type : Bullish
Timeframe : Weekly
Technical
Technical analysis of this Daily chart of LAM RESEARCH CORP. indicates that the overall trend is strongly bullish. The signals given by the moving averages are 92.86% bullish. This strong bullish trend is confirmed by the strong signals currently being given by short-term moving averages. The Central Indicators market scanner is currently detecting a bullish signal that could impact this trend:
Moving Average bullish crossovers : MA50 & MA100
Type : Bullish
Timeframe : Daily
The probability of a further increase are moderate given the direction of the technical indicators.
Caution: the Central Indicators scanner currently detects an excess:
CCI indicator is overbought : over 100
Type : Neutral
Timeframe : Daily
Williams %R indicator is overbought : over -20
Type : Neutral
Timeframe : Daily
Pivot points : price is over resistance 2
Type : Neutral
Timeframe : Weekly
Price is back under the pivot point
Type : Bearish
Timeframe : Daily
The Central Patterns scanner, which studies chart patterns, resistances and supports, has identified this signal:
Near horizontal support
Type : Bullish
Timeframe : Daily
Central Candlesticks, the scanner specialised in Japanese candlesticks, detects this inversion signal that could impact the current short-term trend:
Doji
Type : Neutral
Timeframe : Daily
| S3 | S2 | S1 | Price | |
|---|---|---|---|---|
| ProTrendLines | 625.23 | 647.71 | 712.12 | 730.97 |
| Change (%) | -14.47% | -11.39% | -2.58% | - |
| Change | -105.74 | -83.26 | -18.85 | - |
| Level | Intermediate | Major | Major | - |
To determine price objectives, it is also possible to use the pivot points. Here is the price position in relation to pivot points:
| Pivot points | S3 | S2 | S1 | PP | R1 | R2 | R3 |
|---|---|---|---|---|---|---|---|
| Standard | 714.28 | 720.69 | 725.97 | 732.38 | 737.66 | 744.07 | 749.35 |
| Camarilla | 728.03 | 729.10 | 730.17 | 731.24 | 732.31 | 733.38 | 734.46 |
| Woodie | 713.71 | 720.41 | 725.40 | 732.10 | 737.09 | 743.79 | 748.78 |
| Fibonacci | 720.69 | 725.16 | 727.92 | 732.38 | 736.85 | 739.61 | 744.07 |
| Pivot points | S3 | S2 | S1 | PP | R1 | R2 | R3 |
|---|---|---|---|---|---|---|---|
| Standard | 656.90 | 671.11 | 686.18 | 700.39 | 715.46 | 729.67 | 744.74 |
| Camarilla | 693.21 | 695.89 | 698.58 | 701.26 | 703.94 | 706.63 | 709.31 |
| Woodie | 657.34 | 671.33 | 686.62 | 700.61 | 715.90 | 729.89 | 745.18 |
| Fibonacci | 671.11 | 682.29 | 689.20 | 700.39 | 711.57 | 718.48 | 729.67 |
| Pivot points | S3 | S2 | S1 | PP | R1 | R2 | R3 |
|---|---|---|---|---|---|---|---|
| Standard | 482.61 | 534.89 | 624.43 | 676.71 | 766.25 | 818.53 | 908.07 |
| Camarilla | 674.97 | 687.97 | 700.97 | 713.97 | 726.97 | 739.97 | 752.97 |
| Woodie | 501.24 | 544.21 | 643.06 | 686.03 | 784.88 | 827.85 | 926.70 |
| Fibonacci | 534.89 | 589.07 | 622.54 | 676.71 | 730.89 | 764.36 | 818.53 |
Numerical data
The following is the status of technical indicators and moving averages registered at the time this technical analysis was created:
| RSI (14): | 65.48 | |
| MACD (12,26,9): | 17.3700 | |
| Directional Movement: | 20.44 | |
| AROON (14): | 35.72 | |
| DEMA (21): | 727.73 | |
| Parabolic SAR (0,02-0,02-0,2): | 688.42 | |
| Elder Ray (13): | 20.07 | |
| Super Trend (3,10): | 683.25 | |
| Zig ZAG (10): | 731.92 | |
| VORTEX (21): | 1.0400 | |
| Stochastique (14,3,5): | 89.15 | |
| TEMA (21): | 731.36 | |
| Williams %R (14): | -13.65 | |
| Chande Momentum Oscillator (20): | 10.99 | |
| Repulse (5,40,3): | 1.3400 | |
| ROCnROLL: | 1 | |
| TRIX (15,9): | 0.4100 | |
| Courbe Coppock: | 3.06 |
| MA7: | 713.22 | |
| MA20: | 711.04 | |
| MA50: | 660.56 | |
| MA100: | 660.08 | |
| MAexp7: | 720.15 | |
| MAexp20: | 703.86 | |
| MAexp50: | 676.91 | |
| MAexp100: | 653.33 | |
| Price / MA7: | +2.49% | |
| Price / MA20: | +2.80% | |
| Price / MA50: | +10.66% | |
| Price / MA100: | +10.74% | |
| Price / MAexp7: | +1.50% | |
| Price / MAexp20: | +3.85% | |
| Price / MAexp50: | +7.99% | |
| Price / MAexp100: | +11.88% |
News
Don't forget to follow the news on LAM RESEARCH CORP.. At the time of publication of this analysis, the latest news was as follows:
- Lam Research Corporation Announces Participation at Upcoming Conference
- Lam Research Corporation Declares Quarterly Dividend
- Lam Research Corporation Reports Financial Results for the Quarter Ended September 24, 2023
- Lam Research Corporation Announces September 2023 Quarter Financial Conference Call
- FIRST Global, Title Sponsor Lam Research to Host the World's Most International Innovation Challenge to Inspire Kids in STEM, Future Solutions for Climate Change
About author
Online


Add a comment
Comments
0 comments on the analysis LAM RESEARCH CORP. - Daily