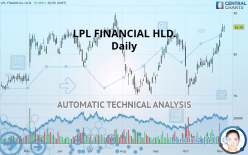
LPL FINANCIAL HLD. - Daily - Technical analysis published on 11/06/2019 (GMT)
- Who voted?
- 216
- 0
Click here for a new analysis!
- Timeframe : Daily
- - Analysis generated on
- Status : TARGET REACHED

Summary of the analysis

Additional analysis
Quotes
The LPL FINANCIAL HLD. price is 86.55 USD. The price registered an increase of +0.06% on the session and was between 85.32 USD and 87.00 USD. This implies that the price is at +1.44% from its lowest and at -0.52% from its highest.The Central Gaps scanner detects a bearish opening. A small advantage for sellers in the very short term.
Bearish opening
Type : Bearish
Timeframe : Openning
Here is a more detailed summary of the historical variations registered by LPL FINANCIAL HLD.:
Near a new HIGH record (5 years)
Type : Bullish
Timeframe : Weekly
Near a new HIGH record (1 year)
Type : Bullish
Timeframe : Weekly
Near a new HIGH record (1st january)
Type : Bullish
Timeframe : Weekly
Near a new HIGH record (1 month)
Type : Bullish
Timeframe : Weekly
Technical
Technical analysis of LPL FINANCIAL HLD. in Daily shows a strongly overall bullish trend. 89.29% of the signals given by moving averages are bullish. This strongly bullish trend is supported by the strong bullish signals given by short-term moving averages. The Central Indicators scanner detects a bullish signal on moving averages that could impact this trend:
Moving Average bullish crossovers : MA20 & MA50
Type : Bullish
Timeframe : Daily
Technical indicators are strongly bullish, suggesting that the price increase should continue.
Caution: the Central Indicators scanner currently detects an excess:
RSI indicator is overbought : over 70
Type : Neutral
Timeframe : Daily
CCI indicator is overbought : over 100
Type : Neutral
Timeframe : Daily
Williams %R indicator is overbought : over -20
Type : Neutral
Timeframe : Daily
Pivot points : price is over resistance 1
Type : Neutral
Timeframe : Weekly
Price is back over the pivot point
Type : Bullish
Timeframe : Daily
Central Patterns, the market scanner focusing on chart patterns, resistances and supports found these results:
Horizontal resistance is broken
Type : Bullish
Timeframe : Daily
Resistance of channel is broken
Type : Bullish
Timeframe : Daily
The Central Candlesticks scanner which studies Japanese candlesticks did not detect anything.
| S3 | S2 | S1 | Price | R1 | |
|---|---|---|---|---|---|
| ProTrendLines | 72.22 | 77.21 | 84.56 | 86.55 | 87.40 |
| Change (%) | -16.56% | -10.79% | -2.30% | - | +0.98% |
| Change | -14.33 | -9.34 | -1.99 | - | +0.85 |
| Level | Major | Major | Major | - | Major |
Pivot points can also be used to set your price objectives. Here is the price situation in relation to pivot points:
| Pivot points | S3 | S2 | S1 | PP | R1 | R2 | R3 |
|---|---|---|---|---|---|---|---|
| Standard | 83.60 | 84.49 | 85.49 | 86.38 | 87.38 | 88.27 | 89.27 |
| Camarilla | 85.98 | 86.15 | 86.33 | 86.50 | 86.67 | 86.85 | 87.02 |
| Woodie | 83.67 | 84.52 | 85.56 | 86.41 | 87.45 | 88.30 | 89.34 |
| Fibonacci | 84.49 | 85.21 | 85.66 | 86.38 | 87.10 | 87.55 | 88.27 |
| Pivot points | S3 | S2 | S1 | PP | R1 | R2 | R3 |
|---|---|---|---|---|---|---|---|
| Standard | 75.36 | 77.43 | 80.37 | 82.44 | 85.38 | 87.45 | 90.39 |
| Camarilla | 81.92 | 82.38 | 82.84 | 83.30 | 83.76 | 84.22 | 84.68 |
| Woodie | 75.79 | 77.65 | 80.80 | 82.66 | 85.81 | 87.67 | 90.82 |
| Fibonacci | 77.43 | 79.35 | 80.53 | 82.44 | 84.36 | 85.54 | 87.45 |
| Pivot points | S3 | S2 | S1 | PP | R1 | R2 | R3 |
|---|---|---|---|---|---|---|---|
| Standard | 60.09 | 65.12 | 72.98 | 78.00 | 85.86 | 90.89 | 98.75 |
| Camarilla | 77.30 | 78.48 | 79.66 | 80.84 | 82.02 | 83.20 | 84.38 |
| Woodie | 61.51 | 65.83 | 74.40 | 78.71 | 87.28 | 91.60 | 100.17 |
| Fibonacci | 65.12 | 70.04 | 73.08 | 78.00 | 82.92 | 85.97 | 90.89 |
Numerical data
The following are the details of the technical indicators and moving averages that were collected to generate this technical analysis:
| RSI (14): | 70.85 | |
| MACD (12,26,9): | 1.9400 | |
| Directional Movement: | 17.85 | |
| AROON (14): | 50.00 | |
| DEMA (21): | 83.07 | |
| Parabolic SAR (0,02-0,02-0,2): | 80.02 | |
| Elder Ray (13): | 4.01 | |
| Super Trend (3,10): | 79.41 | |
| Zig ZAG (10): | 86.48 | |
| VORTEX (21): | 1.1900 | |
| Stochastique (14,3,5): | 92.49 | |
| TEMA (21): | 84.83 | |
| Williams %R (14): | -6.82 | |
| Chande Momentum Oscillator (20): | 8.40 | |
| Repulse (5,40,3): | 2.3500 | |
| ROCnROLL: | 1 | |
| TRIX (15,9): | 0.1600 | |
| Courbe Coppock: | 17.70 |
| MA7: | 83.62 | |
| MA20: | 79.81 | |
| MA50: | 79.20 | |
| MA100: | 79.58 | |
| MAexp7: | 83.95 | |
| MAexp20: | 81.01 | |
| MAexp50: | 79.57 | |
| MAexp100: | 78.95 | |
| Price / MA7: | +3.50% | |
| Price / MA20: | +8.45% | |
| Price / MA50: | +9.28% | |
| Price / MA100: | +8.76% | |
| Price / MAexp7: | +3.10% | |
| Price / MAexp20: | +6.84% | |
| Price / MAexp50: | +8.77% | |
| Price / MAexp100: | +9.63% |
News
Don"t forget to follow the news on LPL FINANCIAL HLD.. At the time of publication of this analysis, the latest news was as follows:
- Wayne von Borstel Qualifies for LPL Financial's Elite Executive Council
- New Research Coverage Highlights LPL Financial, Under Armour, Washington Prime Group, TRI Pointe Group, Trinity Industries, and Ryder System — Consolidated Revenues, Company Growth, and Expectations for 2018
- AdvisoryWorld Acquired by LPL Financial
- Ward Keever Recognized As One Of LPL Financial's Top Financial Advisors
- Craig Smith Honored As A Top Advisor By LPL Financial
About author

Online


Add a comment
Comments
0 comments on the analysis LPL FINANCIAL HLD. - Daily