MARATHON PETROLEUM - Daily - Technical analysis published on 11/04/2019 (GMT)
- Who voted?
- 273
- 0
Click here for a new analysis!
- Timeframe : Daily
- - Analysis generated on
- Status : TARGET REACHED

Summary of the analysis

Additional analysis
Quotes
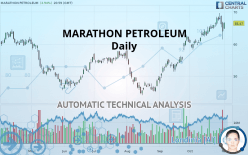
The MARATHON PETROLEUM rating is 66.47 USD. The price has increased by +3.94% since the last closing and was between 64.73 USD and 66.83 USD. This implies that the price is at +2.69% from its lowest and at -0.54% from its highest.A bullish opening was detected by the Central Gaps scanner. Buyers are trying to impose a bullish momentum in the very short term.
Bullish opening
Type : Bullish
Timeframe : Openning
So that you have an overall view of the price change, here is a table showing the variations over several periods:
Near a new HIGH record (1st january)
Type : Bullish
Timeframe : Weekly
Near a new HIGH record (1 month)
Type : Bullish
Timeframe : Weekly
Technical
Technical analysis of MARATHON PETROLEUM in Daily shows a strongly overall bullish trend. 92.86% of the signals given by moving averages are bullish. The overall trend is supported by the strong bullish signals from short-term moving averages. The Central Indicators market scanner is currently detecting several bearish signals that could impact this trend:
Bearish price crossover with Moving Average 20
Type : Bearish
Timeframe : Daily
Bearish price crossover with adaptative moving average 20
Type : Bearish
Timeframe : Daily
An assessment of technical indicators does not currently provide any relevant information to suggest whether the signal given by the technical indicators is more bullish or bearish.
Caution: the Central Indicators scanner currently detects an excess:
Williams %R indicator is overbought : over -20
Type : Neutral
Timeframe : Daily
Price is back over the pivot point
Type : Bullish
Timeframe : Weekly
Price is back under the pivot point
Type : Bearish
Timeframe : Daily
Momentum indicator is back under 0
Type : Bearish
Timeframe : Daily
Williams %R indicator is back under -50
Type : Bearish
Timeframe : Daily
Central Patterns, the scanner specializing in chart patterns, did not identify any signals.
The presence of a bearish pattern in Japanese candlesticks detected by Central Candlesticks that could cause a correction in the very short term was also detected:
Long black line
Type : Bearish
Timeframe : Daily
| S3 | S2 | S1 | Price | R1 | R2 | R3 | |
|---|---|---|---|---|---|---|---|
| ProTrendLines | 54.36 | 59.23 | 62.39 | 66.47 | 67.18 | 69.20 | 86.39 |
| Change (%) | -18.22% | -10.89% | -6.14% | - | +1.07% | +4.11% | +29.97% |
| Change | -12.11 | -7.24 | -4.08 | - | +0.71 | +2.73 | +19.92 |
| Level | Minor | Major | Major | - | Intermediate | Intermediate | Major |
To determine price objectives, it is also possible to use the pivot points. Here is the price position in relation to pivot points:
| Pivot points | S3 | S2 | S1 | PP | R1 | R2 | R3 |
|---|---|---|---|---|---|---|---|
| Standard | 55.68 | 58.53 | 61.24 | 64.09 | 66.80 | 69.65 | 72.36 |
| Camarilla | 62.42 | 62.93 | 63.44 | 63.95 | 64.46 | 64.97 | 65.48 |
| Woodie | 55.61 | 58.50 | 61.17 | 64.06 | 66.73 | 69.62 | 72.29 |
| Fibonacci | 58.53 | 60.65 | 61.97 | 64.09 | 66.21 | 67.53 | 69.65 |
| Pivot points | S3 | S2 | S1 | PP | R1 | R2 | R3 |
|---|---|---|---|---|---|---|---|
| Standard | 61.79 | 63.23 | 65.62 | 67.06 | 69.45 | 70.89 | 73.28 |
| Camarilla | 66.96 | 67.31 | 67.66 | 68.01 | 68.36 | 68.71 | 69.06 |
| Woodie | 62.27 | 63.47 | 66.10 | 67.30 | 69.93 | 71.13 | 73.76 |
| Fibonacci | 63.23 | 64.69 | 65.60 | 67.06 | 68.52 | 69.43 | 70.89 |
| Pivot points | S3 | S2 | S1 | PP | R1 | R2 | R3 |
|---|---|---|---|---|---|---|---|
| Standard | 46.83 | 52.54 | 58.24 | 63.95 | 69.65 | 75.36 | 81.06 |
| Camarilla | 60.81 | 61.86 | 62.90 | 63.95 | 65.00 | 66.04 | 67.09 |
| Woodie | 46.84 | 52.54 | 58.25 | 63.95 | 69.66 | 75.36 | 81.07 |
| Fibonacci | 52.54 | 56.90 | 59.59 | 63.95 | 68.31 | 71.00 | 75.36 |
Numerical data
The following are the details of the technical indicators and moving averages that were collected to generate this technical analysis:
| RSI (14): | 61.35 | |
| MACD (12,26,9): | 2.2900 | |
| Directional Movement: | 0.82 | |
| AROON (14): | -14.29 | |
| DEMA (21): | 67.49 | |
| Parabolic SAR (0,02-0,02-0,2): | 69.32 | |
| Elder Ray (13): | 0.41 | |
| Super Trend (3,10): | 63.44 | |
| Zig ZAG (10): | 66.41 | |
| VORTEX (21): | 1.1000 | |
| Stochastique (14,3,5): | 48.31 | |
| TEMA (21): | 67.48 | |
| Williams %R (14): | -39.18 | |
| Chande Momentum Oscillator (20): | 3.72 | |
| Repulse (5,40,3): | -1.1400 | |
| ROCnROLL: | 1 | |
| TRIX (15,9): | 0.6500 | |
| Courbe Coppock: | 13.62 |
| MA7: | 66.64 | |
| MA20: | 64.37 | |
| MA50: | 58.14 | |
| MA100: | 54.90 | |
| MAexp7: | 66.02 | |
| MAexp20: | 64.24 | |
| MAexp50: | 60.02 | |
| MAexp100: | 57.36 | |
| Price / MA7: | -0.26% | |
| Price / MA20: | +3.26% | |
| Price / MA50: | +14.33% | |
| Price / MA100: | +21.07% | |
| Price / MAexp7: | +0.68% | |
| Price / MAexp20: | +3.47% | |
| Price / MAexp50: | +10.75% | |
| Price / MAexp100: | +15.88% |
News
The last news published on MARATHON PETROLEUM at the time of the generation of this analysis was as follows:
- Gary R. Heminger Announces Plan To Retire From Marathon Petroleum In 2020 After 45 Years
- Marathon Petroleum Corporation And MPLX LP Announce The Retirement Of Gregory J. Goff And Appointment Of Michael J. Hennigan As CEO Of MPLX GP LLC
- Marathon Petroleum Corp. Reports Third-Quarter Results
- Marathon Petroleum Provides Update On Strategic Review To Enhance Shareholder Value
- Marathon Petroleum Corp. Announces Quarterly Dividend
About author

Online


Add a comment
Comments
0 comments on the analysis MARATHON PETROLEUM - Daily