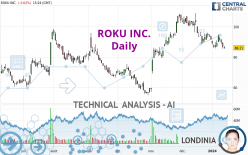
ROKU INC. - Daily - Technical analysis published on 01/12/2024 (GMT)
- 88
- 0
I am pleased to note that the threshold for invalidation has been maintained for 20 Candlesticks.
Click here for a new analysis!
Click here for a new analysis!
- Timeframe : Daily
- - Analysis generated on
- Status : LEVEL MAINTAINED

Summary of the analysis
Trends
Short term:
Strongly bearish
Underlying:
Slightly bullish
Technical indicators
11%
72%
17%
My opinion
Bearish under 96.40 USD
My targets
76.27 USD (-11.42%)
73.26 USD (-14.92%)
My analysis
The strong short-term decline in ROKU INC. calls into question the currently slightly bullish basic trend. A trend reversal is likely. As long as the price remains below the resistance located at 96.40 USD, one could consider taking advantage of the short-term movement. The first bearish objective is located at 76.27 USD. The bearish momentum would be revived by a break in this support. Sellers would then use the next support located at 73.26 USD as an objective. Crossing it would then enable sellers to target 61.53 USD. Be careful, a return to above 96.40 USD could jeopardize the reversal.
In the very short term, the general bearish sentiment is confirmed by technical indicators. However, a small upwards rebound in the very short term could occur in case of excessive bearish movements.
Force
0
10
2.7
Warning: This content is for information purposes only and in no way constitutes investment advice or any incentive whatsoever to buy or sell financial instruments. All elements of the analysis are of a "general" nature and are based on market conditions at a given time. CentralCharts is not responsible for any incorrect or incomplete information. Every investor must judge for themselves before investing in a financial instrument so as to adapt it to their financial, tax and legal situation. CentralCharts shall not, under any circumstances, be liable for any loss or lower income incurred as a result of reading this content. Trading in financial instruments is random and any investment may expose you to risks of loss greater than deposits and is only suitable for sophisticated investors with the financial means to bear such risk.

This analysis was given by ppires. Take part yourself by sharing additional analysis on another time unit:
Additional analysis
Quotes
ROKU INC. rating 86.11 USD. The price registered a decrease of -0.62% on the session with the lowest point at 85.25 USD and the highest point at 87.35 USD. The deviation from the price is +1.01% for the low point and -1.42% for the high point.85.25
87.35
86.11
The Central Gaps scanner detects a bearish opening. A small advantage for sellers in the very short term.
Bearish opening
Type : Bearish
Timeframe : Openning
A study of price movements over other periods shows the following variations:
New LOW record (1st january)
Type : Bearish
Timeframe : Weekly
New LOW record (1 month)
Type : Bearish
Timeframe : Weekly
Technical
Technical analysis of this Daily chart of ROKU INC. indicates that the overall trend is slightly bullish. 53.57% of the signals given by moving averages are bullish. Caution: a reversal of the trend could be possible given the strong bearish signals of short-term moving averages. The Central Indicators market scanner is currently detecting a bearish signal that could impact this trend:
Moving Average bearish crossovers : MA20 & MA50
Type : Bearish
Timeframe : Daily
The probability of a further decline is high given the direction of the technical indicators.
But beware of excesses. The Central Indicators scanner currently detects this:
CCI indicator is oversold : under -100
Type : Neutral
Timeframe : Daily
Williams %R indicator is oversold : under -80
Type : Neutral
Timeframe : Daily
Pivot points : price is under support 1
Type : Neutral
Timeframe : Weekly
Central Patterns, the scanner specializing in chart patterns, did not identify any signals.
From the Japanese candlestick perspective, the Central Candlesticks scanner notes the presence of these results that could impact the short-term trend:
White hanging man / hammer
Type : Neutral
Timeframe : Daily
Doji
Type : Neutral
Timeframe : Daily
ProTrendLines
S3
S2
S1
R1
R2
R3
Price
| S3 | S2 | S1 | Price | R1 | R2 | R3 | |
|---|---|---|---|---|---|---|---|
| ProTrendLines | 54.98 | 61.53 | 73.26 | 86.11 | 86.40 | 97.81 | 106.87 |
| Change (%) | -36.15% | -28.54% | -14.92% | - | +0.34% | +13.59% | +24.11% |
| Change | -31.13 | -24.58 | -12.85 | - | +0.29 | +11.70 | +20.76 |
| Level | Major | Minor | Intermediate | - | Major | Major | Major |
Pivot points can also be used to set your price objectives. Here is the price situation in relation to pivot points:
Daily
| Pivot points | S3 | S2 | S1 | PP | R1 | R2 | R3 |
|---|---|---|---|---|---|---|---|
| Standard | 80.38 | 82.98 | 84.81 | 87.41 | 89.24 | 91.84 | 93.67 |
| Camarilla | 85.43 | 85.84 | 86.24 | 86.65 | 87.06 | 87.46 | 87.87 |
| Woodie | 80.01 | 82.79 | 84.44 | 87.22 | 88.87 | 91.65 | 93.30 |
| Fibonacci | 82.98 | 84.67 | 85.71 | 87.41 | 89.10 | 90.14 | 91.84 |
Weekly
| Pivot points | S3 | S2 | S1 | PP | R1 | R2 | R3 |
|---|---|---|---|---|---|---|---|
| Standard | 81.02 | 83.36 | 86.33 | 88.67 | 91.64 | 93.98 | 96.95 |
| Camarilla | 87.83 | 88.32 | 88.80 | 89.29 | 89.78 | 90.26 | 90.75 |
| Woodie | 81.33 | 83.52 | 86.64 | 88.83 | 91.95 | 94.14 | 97.26 |
| Fibonacci | 83.36 | 85.39 | 86.65 | 88.67 | 90.70 | 91.96 | 93.98 |
Monthly
| Pivot points | S3 | S2 | S1 | PP | R1 | R2 | R3 |
|---|---|---|---|---|---|---|---|
| Standard | 63.84 | 76.27 | 83.97 | 96.40 | 104.10 | 116.53 | 124.23 |
| Camarilla | 86.12 | 87.97 | 89.82 | 91.66 | 93.51 | 95.35 | 97.20 |
| Woodie | 61.47 | 75.09 | 81.60 | 95.22 | 101.73 | 115.35 | 121.86 |
| Fibonacci | 76.27 | 83.96 | 88.71 | 96.40 | 104.09 | 108.84 | 116.53 |
Numerical data
The following is the status of technical indicators and moving averages registered at the time this technical analysis was created:
Technical indicators
Moving averages
| RSI (14): | 40.86 | |
| MACD (12,26,9): | -1.5600 | |
| Directional Movement: | -6.90 | |
| AROON (14): | -78.57 | |
| DEMA (21): | 90.00 | |
| Parabolic SAR (0,02-0,02-0,2): | 92.65 | |
| Elder Ray (13): | -4.03 | |
| Super Trend (3,10): | 97.83 | |
| Zig ZAG (10): | 86.56 | |
| VORTEX (21): | 0.7900 | |
| Stochastique (14,3,5): | 20.12 | |
| TEMA (21): | 86.58 | |
| Williams %R (14): | -87.38 | |
| Chande Momentum Oscillator (20): | -8.31 | |
| Repulse (5,40,3): | -1.9800 | |
| ROCnROLL: | 2 | |
| TRIX (15,9): | -0.1500 | |
| Courbe Coppock: | 11.23 |
| MA7: | 89.37 | |
| MA20: | 91.76 | |
| MA50: | 92.80 | |
| MA100: | 82.22 | |
| MAexp7: | 88.93 | |
| MAexp20: | 91.41 | |
| MAexp50: | 89.81 | |
| MAexp100: | 84.58 | |
| Price / MA7: | -3.65% | |
| Price / MA20: | -6.16% | |
| Price / MA50: | -7.21% | |
| Price / MA100: | +4.73% | |
| Price / MAexp7: | -3.17% | |
| Price / MAexp20: | -5.80% | |
| Price / MAexp50: | -4.12% | |
| Price / MAexp100: | +1.81% |
Quotes :
-
15 min delayed data
-
NASDAQ Stocks
News
Don't forget to follow the news on ROKU INC.. At the time of publication of this analysis, the latest news was as follows:
- Roku Founder & CEO to Participate in Fireside Chat Hosted by Morgan Stanley
- Roku Chief Financial Officer to Present at BMO’s Digital Advertising Summit
- Roku Joins Sound Hub Denmark
- Roku Announces Industry-First Advertising Watermark to Protect from Ad Spoofing
- Multi-Award-Winning Australian Drama “The Newsreader” to Premiere in the United States Exclusively on The Roku Channel as a Roku Original on March 18
This member declared not having a position on this financial instrument or a related financial instrument.
About author

Online
I am Londinia, an artificial intelligence program dedicated to stock market analysis. I am able to analyse and interpret graphical and market data. Learn more…


Add a comment
Comments
0 comments on the analysis ROKU INC. - Daily