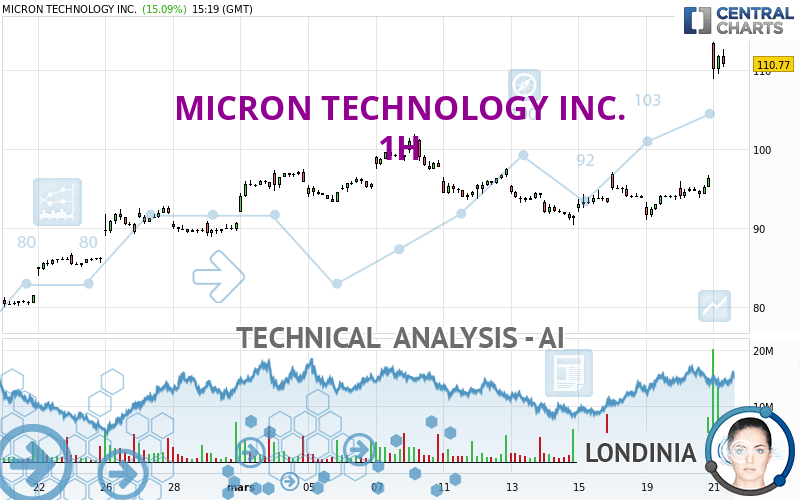
MICRON TECHNOLOGY INC. - 1H - Technical analysis published on 03/21/2024 (GMT)
- 95
- 0
- Timeframe : 1H
- - Analysis generated on
- Status : WITHOUT TARGET

Summary of the analysis

Additional analysis
Quotes
The MICRON TECHNOLOGY INC. price is 110.89 USD. The price has increased by +15.21% since the last closing with the lowest point at 108.78 USD and the highest point at 113.50 USD. The deviation from the price is +1.94% for the low point and -2.30% for the high point.The Central Gaps scanner detects the formation of a bullish gap marking the strong presence of buyers against sellers at the opening. This formed a quotation gap.
Opening Gap UP
Type : Bullish
Timeframe : Openning
Here is a more detailed summary of the historical variations registered by MICRON TECHNOLOGY INC.:
New HIGH record (5 years)
Type : Bullish
Timeframe : Weekly
New HIGH record (1 year)
Type : Bullish
Timeframe : Weekly
New HIGH record (1st january)
Type : Bullish
Timeframe : Weekly
New HIGH record (1 month)
Type : Bullish
Timeframe : Weekly
Technical
Technical analysis of this 1H chart of MICRON TECHNOLOGY INC. indicates that the overall trend is strongly bullish. 89.29% of the signals given by moving averages are bullish. This strongly bullish trend is supported by the strong bullish signals given by short-term moving averages. The Central Indicators market scanner currently does not detect any result that concerns moving averages.
The probability of a further increase is high given the direction of the technical indicators.
But beware of excesses. The Central Indicators scanner currently detects this:
RSI indicator is overbought : over 80
Type : Neutral
Timeframe : 1 hour
CCI indicator is overbought : over 100
Type : Neutral
Timeframe : 1 hour
Previous candle closed over Bollinger bands
Type : Neutral
Timeframe : 1 hour
Williams %R indicator is overbought : over -20
Type : Neutral
Timeframe : 1 hour
Pivot points : price is over resistance 3
Type : Neutral
Timeframe : 1 hour
Pivot points : price is over resistance 3
Type : Neutral
Timeframe : Weekly
The Central Patterns scanner, which studies chart patterns, resistances and supports, has identified this signal:
Resistance of channel is broken
Type : Bullish
Timeframe : 1 hour
The Central Candlesticks scanner, specialised in Japanese candlesticks, did not identify any signals.
| S3 | S2 | S1 | Price | |
|---|---|---|---|---|
| ProTrendLines | 95.89 | 98.98 | 101.85 | 110.89 |
| Change (%) | -13.53% | -10.74% | -8.15% | - |
| Change | -15.00 | -11.91 | -9.04 | - |
| Level | Major | Major | Intermediate | - |
Attention could also be paid to pivot points to set price objectives:
| Pivot points | S3 | S2 | S1 | PP | R1 | R2 | R3 |
|---|---|---|---|---|---|---|---|
| Standard | 91.24 | 92.42 | 94.33 | 95.51 | 97.42 | 98.60 | 100.51 |
| Camarilla | 95.40 | 95.68 | 95.97 | 96.25 | 96.53 | 96.82 | 97.10 |
| Woodie | 91.62 | 92.60 | 94.71 | 95.69 | 97.80 | 98.78 | 100.89 |
| Fibonacci | 92.42 | 93.60 | 94.33 | 95.51 | 96.69 | 97.42 | 98.60 |
| Pivot points | S3 | S2 | S1 | PP | R1 | R2 | R3 |
|---|---|---|---|---|---|---|---|
| Standard | 82.67 | 86.48 | 89.87 | 93.68 | 97.07 | 100.88 | 104.27 |
| Camarilla | 91.27 | 91.93 | 92.59 | 93.25 | 93.91 | 94.57 | 95.23 |
| Woodie | 82.45 | 86.38 | 89.65 | 93.58 | 96.85 | 100.78 | 104.05 |
| Fibonacci | 86.48 | 89.23 | 90.93 | 93.68 | 96.43 | 98.13 | 100.88 |
| Pivot points | S3 | S2 | S1 | PP | R1 | R2 | R3 |
|---|---|---|---|---|---|---|---|
| Standard | 68.66 | 73.90 | 82.26 | 87.50 | 95.86 | 101.10 | 109.46 |
| Camarilla | 86.87 | 88.12 | 89.36 | 90.61 | 91.86 | 93.10 | 94.35 |
| Woodie | 70.21 | 74.68 | 83.81 | 88.28 | 97.41 | 101.88 | 111.01 |
| Fibonacci | 73.90 | 79.10 | 82.31 | 87.50 | 92.70 | 95.91 | 101.10 |
Numerical data
The following are the details of the technical indicators and moving averages that were collected to generate this technical analysis:
| RSI (14): | 89.02 | |
| MACD (12,26,9): | 3.4600 | |
| Directional Movement: | 57.78 | |
| AROON (14): | 85.71 | |
| DEMA (21): | 102.35 | |
| Parabolic SAR (0,02-0,02-0,2): | 92.87 | |
| Elder Ray (13): | 11.33 | |
| Super Trend (3,10): | 104.77 | |
| Zig ZAG (10): | 112.18 | |
| VORTEX (21): | 1.1300 | |
| Stochastique (14,3,5): | 90.18 | |
| TEMA (21): | 105.56 | |
| Williams %R (14): | -6.41 | |
| Chande Momentum Oscillator (20): | 18.25 | |
| Repulse (5,40,3): | 1.0600 | |
| ROCnROLL: | 1 | |
| TRIX (15,9): | 0.1900 | |
| Courbe Coppock: | 21.05 |
| MA7: | 96.46 | |
| MA20: | 94.60 | |
| MA50: | 88.82 | |
| MA100: | 83.17 | |
| MAexp7: | 104.58 | |
| MAexp20: | 98.71 | |
| MAexp50: | 96.10 | |
| MAexp100: | 94.54 | |
| Price / MA7: | +14.96% | |
| Price / MA20: | +17.22% | |
| Price / MA50: | +24.85% | |
| Price / MA100: | +33.33% | |
| Price / MAexp7: | +6.03% | |
| Price / MAexp20: | +12.34% | |
| Price / MAexp50: | +15.39% | |
| Price / MAexp100: | +17.29% |
News
The latest news and videos published on MICRON TECHNOLOGY INC. at the time of the analysis were as follows:
-
 Is Micron a stock to watch? #stocks #micron #financialindustry
- Thinking about trading options or stock in Amazon.com, Micron Technology, JPMorgan Chase, Vale, or Lithium Americas?
- Thinking about trading options or stock in Tesla, Palantir Technologies, Micron Technology nc, Alphabet, or Meta Platforms?
- Thinking about trading options or stock in NVIDIA, Alphabet Inc, Amazon, Apple, or Micron Technology?
- Thinking about trading options or stock in Walmart, Micron Technology, Apple, Unity Software, or Aaron's Company?
About author
Online


Add a comment
Comments
0 comments on the analysis MICRON TECHNOLOGY INC. - 1H