MICRON TECHNOLOGY INC. - 1H - Technical analysis published on 04/01/2024 (GMT)
- 99
- 0
Click here for a new analysis!
- Timeframe : 1H
- - Analysis generated on
- Status : INVALID
Summary of the analysis

Additional analysis
Quotes
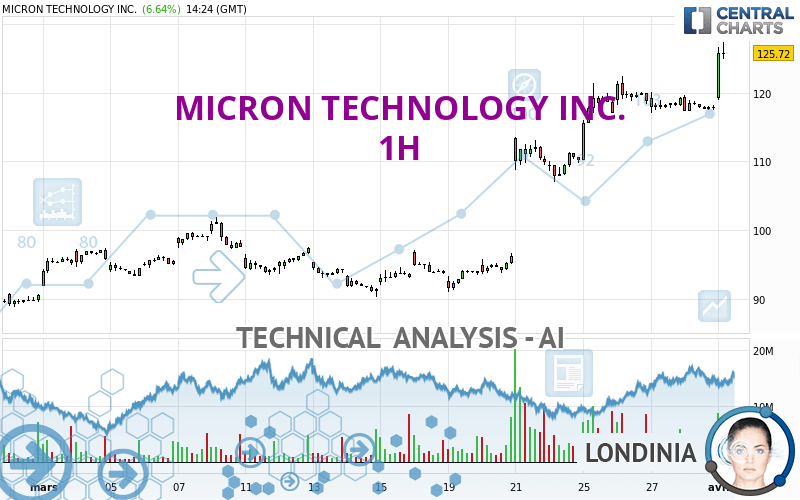
The MICRON TECHNOLOGY INC. price is 126.85 USD. The price registered an increase of +7.60% on the session with the lowest point at 119.00 USD and the highest point at 126.86 USD. The deviation from the price is +6.60% for the low point and -0.01% for the high point.The Central Gaps scanner detects a bullish opening marking the presence of buyers ahead of sellers at the opening but not sufficiently marked to allow the price to register a quotation gap.
Bullish opening
Type : Bullish
Timeframe : Openning
A study of price movements over other periods shows the following variations:
New HIGH record (5 years)
Type : Bullish
Timeframe : Weekly
New HIGH record (1 year)
Type : Bullish
Timeframe : Weekly
New HIGH record (1st january)
Type : Bullish
Timeframe : Weekly
New HIGH record (1 month)
Type : Bullish
Timeframe : Weekly
The Central Volumes scanner detects abnormal volumes on the asset:
Abnormal volumes
Timeframe : 5 days
Technical
Technical analysis of MICRON TECHNOLOGY INC. in 1H shows a strongly overall bullish trend. The signals given by the moving averages are 92.86% bullish. This strong bullish trend is confirmed by the strong signals currently being given by short-term moving averages. The Central Indicators scanner does not detect any result on moving averages that would impact this trend.
The probability of a further increase is high given the direction of the technical indicators.
Caution: the Central Indicators scanner currently detects an excess:
RSI indicator is overbought : over 70
Type : Neutral
Timeframe : 1 hour
CCI indicator is overbought : over 100
Type : Neutral
Timeframe : 1 hour
Previous candle closed over Bollinger bands
Type : Neutral
Timeframe : 1 hour
Williams %R indicator is overbought : over -20
Type : Neutral
Timeframe : 1 hour
Pivot points : price is over resistance 1
Type : Neutral
Timeframe : Weekly
Pivot points : price is over resistance 3
Type : Neutral
Timeframe : 1 hour
MACD crosses UP its Moving Average
Type : Bullish
Timeframe : 1 hour
An analysis of the price chart with the Central Patterns scanner (detector of chart patterns and resistances and supports) shows several results that can have an impact on the price change:
Near horizontal resistance
Type : Bearish
Timeframe : 1 hour
Resistance of channel is broken
Type : Bullish
Timeframe : 1 hour
From the Japanese candlestick perspective, the Central Candlesticks scanner notes the presence of these results that could impact the short-term trend:
Bearish harami
Type : Bearish
Timeframe : 1 hour
Doji
Type : Neutral
Timeframe : 1 hour
Bearish harami cross
Type : Bearish
Timeframe : 1 hour
| S3 | S2 | S1 | Price | |
|---|---|---|---|---|
| ProTrendLines | 106.95 | 117.27 | 122.34 | 126.85 |
| Change (%) | -15.69% | -7.55% | -3.56% | - |
| Change | -19.90 | -9.58 | -4.51 | - |
| Level | Minor | Intermediate | Intermediate | - |
Pivot points can also be used to set your price objectives. Here is the price situation in relation to pivot points:
| Pivot points | S3 | S2 | S1 | PP | R1 | R2 | R3 |
|---|---|---|---|---|---|---|---|
| Standard | 114.67 | 116.01 | 116.95 | 118.29 | 119.23 | 120.57 | 121.51 |
| Camarilla | 117.26 | 117.47 | 117.68 | 117.89 | 118.10 | 118.31 | 118.52 |
| Woodie | 114.47 | 115.91 | 116.75 | 118.19 | 119.03 | 120.47 | 121.31 |
| Fibonacci | 116.01 | 116.88 | 117.42 | 118.29 | 119.16 | 119.70 | 120.57 |
| Pivot points | S3 | S2 | S1 | PP | R1 | R2 | R3 |
|---|---|---|---|---|---|---|---|
| Standard | 98.89 | 104.47 | 111.18 | 116.76 | 123.47 | 129.05 | 135.76 |
| Camarilla | 114.51 | 115.64 | 116.76 | 117.89 | 119.02 | 120.14 | 121.27 |
| Woodie | 99.46 | 104.75 | 111.75 | 117.04 | 124.04 | 129.33 | 136.33 |
| Fibonacci | 104.47 | 109.17 | 112.07 | 116.76 | 121.46 | 124.36 | 129.05 |
| Pivot points | S3 | S2 | S1 | PP | R1 | R2 | R3 |
|---|---|---|---|---|---|---|---|
| Standard | 65.82 | 78.02 | 97.95 | 110.15 | 130.08 | 142.28 | 162.21 |
| Camarilla | 109.05 | 112.00 | 114.95 | 117.89 | 120.84 | 123.78 | 126.73 |
| Woodie | 69.70 | 79.95 | 101.83 | 112.08 | 133.96 | 144.21 | 166.09 |
| Fibonacci | 78.02 | 90.29 | 97.87 | 110.15 | 122.42 | 130.00 | 142.28 |
Numerical data
The following are the details of the technical indicators and moving averages that were collected to generate this technical analysis:
| RSI (14): | 76.26 | |
| MACD (12,26,9): | 2.2500 | |
| Directional Movement: | 36.53 | |
| AROON (14): | 50.00 | |
| DEMA (21): | 122.15 | |
| Parabolic SAR (0,02-0,02-0,2): | 117.16 | |
| Elder Ray (13): | 5.46 | |
| Super Trend (3,10): | 119.97 | |
| Zig ZAG (10): | 126.12 | |
| VORTEX (21): | 1.1600 | |
| Stochastique (14,3,5): | 69.37 | |
| TEMA (21): | 121.30 | |
| Williams %R (14): | -14.83 | |
| Chande Momentum Oscillator (20): | 7.47 | |
| Repulse (5,40,3): | 4.2900 | |
| ROCnROLL: | 1 | |
| TRIX (15,9): | 0.2400 | |
| Courbe Coppock: | 3.37 |
| MA7: | 116.90 | |
| MA20: | 102.73 | |
| MA50: | 92.86 | |
| MA100: | 86.05 | |
| MAexp7: | 121.40 | |
| MAexp20: | 119.04 | |
| MAexp50: | 113.70 | |
| MAexp100: | 107.16 | |
| Price / MA7: | +8.51% | |
| Price / MA20: | +23.48% | |
| Price / MA50: | +36.60% | |
| Price / MA100: | +47.41% | |
| Price / MAexp7: | +4.49% | |
| Price / MAexp20: | +6.56% | |
| Price / MAexp50: | +11.57% | |
| Price / MAexp100: | +18.37% |
News
The latest news and videos published on MICRON TECHNOLOGY INC. at the time of the analysis were as follows:
- Thinking about trading options or stock in Micron Technology, Apple, Amazon.com, Palantir Technologies, or Microsoft?
- Thinking about trading options or stock in Super Micro Computer, Micron Technology, Tesla, Microsoft, or Intel?
- Thinking about trading options or stock in Micron Technology, Apple, PayPal, Super Micro Computer, or GigaCloud Technology?
-
 Is Micron a stock to watch? #stocks #micron #financialindustry
- Thinking about trading options or stock in Amazon.com, Micron Technology, JPMorgan Chase, Vale, or Lithium Americas?
About author
Online


Add a comment
Comments
0 comments on the analysis MICRON TECHNOLOGY INC. - 1H