MICRON TECHNOLOGY INC. - 1H - Technical analysis published on 03/25/2024 (GMT)
- 106
- 0
Click here for a new analysis!
- Timeframe : 1H
- - Analysis generated on
- Status : LEVEL MAINTAINED

Summary of the analysis

Additional analysis
Quotes
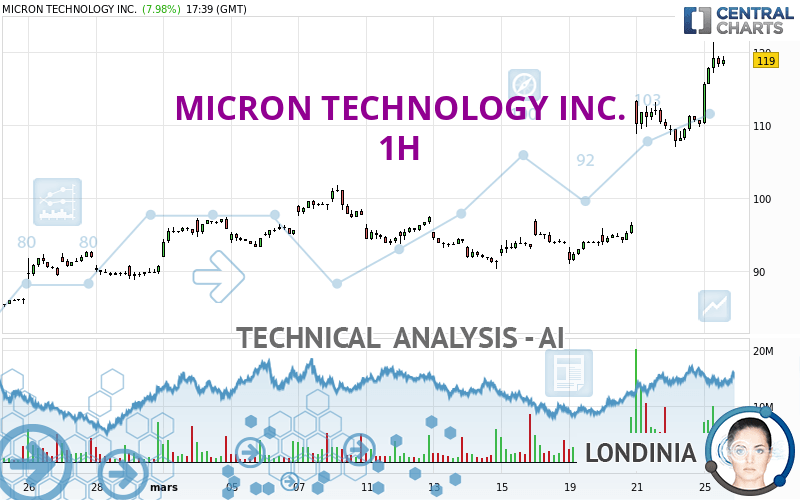
MICRON TECHNOLOGY INC. rating 119.22 USD. On the day, this instrument gained +8.18% with the lowest point at 110.16 USD and the highest point at 121.41 USD. The deviation from the price is +8.22% for the low point and -1.80% for the high point.A bullish opening was detected by the Central Gaps scanner. Buyers are trying to impose a bullish momentum in the very short term.
Bullish opening
Type : Bullish
Timeframe : Openning
Here is a more detailed summary of the historical variations registered by MICRON TECHNOLOGY INC.:
New HIGH record (5 years)
Type : Bullish
Timeframe : Weekly
New HIGH record (1 year)
Type : Bullish
Timeframe : Weekly
New HIGH record (1st january)
Type : Bullish
Timeframe : Weekly
New HIGH record (1 month)
Type : Bullish
Timeframe : Weekly
The Central Volumes scanner detects abnormal volumes on the asset:
Abnormal volumes
Timeframe : 5 days
Technical
Technical analysis of MICRON TECHNOLOGY INC. in 1H shows a strongly overall bullish trend. The signals given by the moving averages are 92.86% bullish. This strong bullish trend is confirmed by the strong signals currently being given by short-term moving averages. The Central Indicators scanner does not detect any result on moving averages that would impact this trend.
The probability of a further increase is high given the direction of the technical indicators.
Caution: the Central Indicators scanner currently detects an excess:
RSI indicator is overbought : over 70
Type : Neutral
Timeframe : 1 hour
CCI indicator is overbought : over 100
Type : Neutral
Timeframe : 1 hour
Williams %R indicator is overbought : over -20
Type : Neutral
Timeframe : 1 hour
Pivot points : price is over resistance 3
Type : Neutral
Timeframe : 1 hour
Central Patterns, the market scanner focusing on chart patterns, resistances and supports found this result:
Resistance of channel is broken
Type : Bullish
Timeframe : 1 hour
For a small rebound in the very short term, the Central Candlesticks scanner currently notes the presence of this bullish pattern in Japanese candlesticks:
Bullish harami
Type : Bullish
Timeframe : 1 hour
| S3 | S2 | S1 | Price | |
|---|---|---|---|---|
| ProTrendLines | 98.98 | 101.85 | 113.44 | 119.22 |
| Change (%) | -16.98% | -14.57% | -4.85% | - |
| Change | -20.24 | -17.37 | -5.78 | - |
| Level | Intermediate | Minor | Intermediate | - |
Pivot points can also be used to set your price objectives. Here is the price situation in relation to pivot points:
| Pivot points | S3 | S2 | S1 | PP | R1 | R2 | R3 |
|---|---|---|---|---|---|---|---|
| Standard | 103.44 | 105.24 | 107.73 | 109.53 | 112.02 | 113.82 | 116.31 |
| Camarilla | 109.03 | 109.42 | 109.82 | 110.21 | 110.60 | 111.00 | 111.39 |
| Woodie | 103.78 | 105.41 | 108.07 | 109.70 | 112.36 | 113.99 | 116.65 |
| Fibonacci | 105.24 | 106.88 | 107.90 | 109.53 | 111.17 | 112.19 | 113.82 |
| Pivot points | S3 | S2 | S1 | PP | R1 | R2 | R3 |
|---|---|---|---|---|---|---|---|
| Standard | 73.81 | 82.40 | 96.31 | 104.90 | 118.81 | 127.40 | 141.31 |
| Camarilla | 104.02 | 106.09 | 108.15 | 110.21 | 112.27 | 114.34 | 116.40 |
| Woodie | 76.46 | 83.73 | 98.96 | 106.23 | 121.46 | 128.73 | 143.96 |
| Fibonacci | 82.40 | 91.00 | 96.31 | 104.90 | 113.50 | 118.81 | 127.40 |
| Pivot points | S3 | S2 | S1 | PP | R1 | R2 | R3 |
|---|---|---|---|---|---|---|---|
| Standard | 68.66 | 73.90 | 82.26 | 87.50 | 95.86 | 101.10 | 109.46 |
| Camarilla | 86.87 | 88.12 | 89.36 | 90.61 | 91.86 | 93.10 | 94.35 |
| Woodie | 70.21 | 74.68 | 83.81 | 88.28 | 97.41 | 101.88 | 111.01 |
| Fibonacci | 73.90 | 79.10 | 82.31 | 87.50 | 92.70 | 95.91 | 101.10 |
Numerical data
The following are the details of the technical indicators and moving averages that were collected to generate this technical analysis:
| RSI (14): | 79.44 | |
| MACD (12,26,9): | 5.0800 | |
| Directional Movement: | 42.36 | |
| AROON (14): | 57.14 | |
| DEMA (21): | 117.46 | |
| Parabolic SAR (0,02-0,02-0,2): | 106.55 | |
| Elder Ray (13): | 5.15 | |
| Super Trend (3,10): | 112.00 | |
| Zig ZAG (10): | 119.47 | |
| VORTEX (21): | 1.2000 | |
| Stochastique (14,3,5): | 83.07 | |
| TEMA (21): | 119.53 | |
| Williams %R (14): | -15.39 | |
| Chande Momentum Oscillator (20): | 9.28 | |
| Repulse (5,40,3): | 2.3200 | |
| ROCnROLL: | 1 | |
| TRIX (15,9): | 0.6600 | |
| Courbe Coppock: | 14.39 |
| MA7: | 102.34 | |
| MA20: | 97.20 | |
| MA50: | 90.05 | |
| MA100: | 84.13 | |
| MAexp7: | 116.36 | |
| MAexp20: | 110.97 | |
| MAexp50: | 104.16 | |
| MAexp100: | 99.55 | |
| Price / MA7: | +16.49% | |
| Price / MA20: | +22.65% | |
| Price / MA50: | +32.39% | |
| Price / MA100: | +41.71% | |
| Price / MAexp7: | +2.46% | |
| Price / MAexp20: | +7.43% | |
| Price / MAexp50: | +14.46% | |
| Price / MAexp100: | +19.76% |
News
The latest news and videos published on MICRON TECHNOLOGY INC. at the time of the analysis were as follows:
- Thinking about trading options or stock in Micron Technology, Apple, PayPal, Super Micro Computer, or GigaCloud Technology?
-
 Is Micron a stock to watch? #stocks #micron #financialindustry
- Thinking about trading options or stock in Amazon.com, Micron Technology, JPMorgan Chase, Vale, or Lithium Americas?
- Thinking about trading options or stock in Tesla, Palantir Technologies, Micron Technology nc, Alphabet, or Meta Platforms?
- Thinking about trading options or stock in NVIDIA, Alphabet Inc, Amazon, Apple, or Micron Technology?
About author
Online


Add a comment
Comments
0 comments on the analysis MICRON TECHNOLOGY INC. - 1H