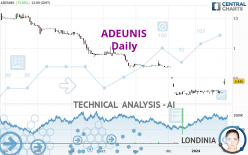
ADEUNIS - Daily - Technical analysis published on 01/31/2024 (GMT)
- 94
- 0
Click here for a new analysis!
- Timeframe : Daily
- - Analysis generated on
- Status : LEVEL MAINTAINED

Summary of the analysis

Additional analysis
Quotes
The ADEUNIS rating is 0.445 EUR. The price has increased by +73.83% since the last closing and was between 0.383 EUR and 0.486 EUR. This implies that the price is at +16.19% from its lowest and at -8.44% from its highest.A bullish gap was detected at the opening by the Central Gaps scanner. There are a lot of buyers and they have the upper hand in the very short term.
Opening Gap UP
Type : Bullish
Timeframe : Openning
Here is a more detailed summary of the historical variations registered by ADEUNIS:
New HIGH record (1st january)
Type : Bullish
Timeframe : Weekly
New HIGH record (1 month)
Type : Bullish
Timeframe : Weekly
Abnormal volumes on ADEUNIS were detected by the Central Volumes scanner:
Abnormal volumes
Timeframe : 5 days
Abnormal volumes
Timeframe : 50 days
Technical
Technical analysis of this Daily chart of ADEUNIS indicates that the overall trend is slightly bearish. 57.14% of the signals given by moving averages are bearish. Caution: the strong bullish signals currently being given by short-term moving averages could quickly lead to a reversal of the trend. An assessment of moving averages reveals several bullish signals that could impact this trend:
Moving Average bullish crossovers : AMA20 & AMA50
Type : Bullish
Timeframe : Daily
Bullish price crossover with Moving Average 20
Type : Bullish
Timeframe : Daily
Bullish price crossover with Moving Average 50
Type : Bullish
Timeframe : Daily
Bullish price crossover with adaptative moving average 20
Type : Bullish
Timeframe : Daily
Bullish price crossover with adaptative moving average 50
Type : Bullish
Timeframe : Daily
Bullish price crossover with adaptative moving average 100
Type : Bullish
Timeframe : Daily
The technical indicators are bullish. There is still some doubt about the price increase.
Caution: the Central Indicators scanner currently detects an excess:
CCI indicator is overbought : over 100
Type : Neutral
Timeframe : Daily
Pivot points : price is over resistance 3
Type : Neutral
Timeframe : Daily
Pivot points : price is over resistance 3
Type : Neutral
Timeframe : Weekly
RSI indicator is back over 50
Type : Bullish
Timeframe : Daily
SuperTrend indicator bullish reversal
Type : Bullish
Timeframe : Daily
Momentum indicator is back over 0
Type : Bullish
Timeframe : Daily
Williams %R indicator is back over -50
Type : Bullish
Timeframe : Daily
No signals are given by Central Patterns, a market scanner specialised in chart patterns, resistances and supports.
Central Candlesticks, the scanner specialised in Japanese candlesticks, detects a bullish signal that could support the hypothesis of a small rebound in the very short term:
Long white line
Type : Bullish
Timeframe : Daily
| S1 | Price | R1 | R2 | R3 | |
|---|---|---|---|---|---|
| ProTrendLines | 0.216 | 0.445 | 0.692 | 1.474 | 1.680 |
| Change (%) | -51.46% | - | +55.51% | +231.24% | +277.53% |
| Change | -0.229 | - | +0.247 | +1.029 | +1.235 |
| Level | Major | - | Minor | Intermediate | Intermediate |
To determine price objectives, it is also possible to use the pivot points. Here is the price position in relation to pivot points:
| Pivot points | S3 | S2 | S1 | PP | R1 | R2 | R3 |
|---|---|---|---|---|---|---|---|
| Standard | 0.256 | 0.256 | 0.256 | 0.256 | 0.256 | 0.256 | 0.256 |
| Camarilla | 0.256 | 0.256 | 0.256 | 0.256 | 0.256 | 0.256 | 0.256 |
| Woodie | 0.256 | 0.256 | 0.256 | 0.256 | 0.256 | 0.256 | 0.256 |
| Fibonacci | 0.256 | 0.256 | 0.256 | 0.256 | 0.256 | 0.256 | 0.256 |
| Pivot points | S3 | S2 | S1 | PP | R1 | R2 | R3 |
|---|---|---|---|---|---|---|---|
| Standard | 0.156 | 0.193 | 0.225 | 0.262 | 0.294 | 0.331 | 0.363 |
| Camarilla | 0.237 | 0.243 | 0.250 | 0.256 | 0.262 | 0.269 | 0.275 |
| Woodie | 0.153 | 0.192 | 0.222 | 0.261 | 0.291 | 0.330 | 0.360 |
| Fibonacci | 0.193 | 0.220 | 0.236 | 0.262 | 0.289 | 0.305 | 0.331 |
| Pivot points | S3 | S2 | S1 | PP | R1 | R2 | R3 |
|---|---|---|---|---|---|---|---|
| Standard | -0.407 | -0.099 | 0.073 | 0.381 | 0.553 | 0.861 | 1.033 |
| Camarilla | 0.112 | 0.156 | 0.200 | 0.244 | 0.288 | 0.332 | 0.376 |
| Woodie | -0.476 | -0.133 | 0.004 | 0.347 | 0.484 | 0.827 | 0.964 |
| Fibonacci | -0.099 | 0.085 | 0.198 | 0.381 | 0.565 | 0.678 | 0.861 |
Numerical data
The following is the status of the technical indicators and moving averages at the time of publication of this technical analysis:
| RSI (14): | 64.62 | |
| MACD (12,26,9): | -0.0140 | |
| Directional Movement: | 22.117 | |
| AROON (14): | 57.143 | |
| DEMA (21): | 0.261 | |
| Parabolic SAR (0,02-0,02-0,2): | 0.223 | |
| Elder Ray (13): | 0.144 | |
| Super Trend (3,10): | 0.283 | |
| Zig ZAG (10): | 0.430 | |
| VORTEX (21): | 0.9120 | |
| Stochastique (14,3,5): | 55.83 | |
| TEMA (21): | 0.311 | |
| Williams %R (14): | -21.13 | |
| Chande Momentum Oscillator (20): | 0.155 | |
| Repulse (5,40,3): | 0.8690 | |
| ROCnROLL: | -1 | |
| TRIX (15,9): | -1.4960 | |
| Courbe Coppock: | 26.57 |
| MA7: | 0.292 | |
| MA20: | 0.275 | |
| MA50: | 0.391 | |
| MA100: | 0.635 | |
| MAexp7: | 0.306 | |
| MAexp20: | 0.294 | |
| MAexp50: | 0.400 | |
| MAexp100: | 0.622 | |
| Price / MA7: | +52.40% | |
| Price / MA20: | +61.82% | |
| Price / MA50: | +13.81% | |
| Price / MA100: | -29.92% | |
| Price / MAexp7: | +45.42% | |
| Price / MAexp20: | +51.36% | |
| Price / MAexp50: | +11.25% | |
| Price / MAexp100: | -28.46% |
News
The latest news and videos published on ADEUNIS at the time of the analysis were as follows:
- ADEUNIS unveils its 2019/2021 roadmap to become a major player in Industrial IoT
- SALE OF VOKKERO(R) FINALISED COMPLETE DE-LEVERAGING OF ADEUNIS REFOCUSED ON IOT
- 2017/2018 results: Implementation of the development plan presented during the IPO
About author
Online


Add a comment
Comments
0 comments on the analysis ADEUNIS - Daily