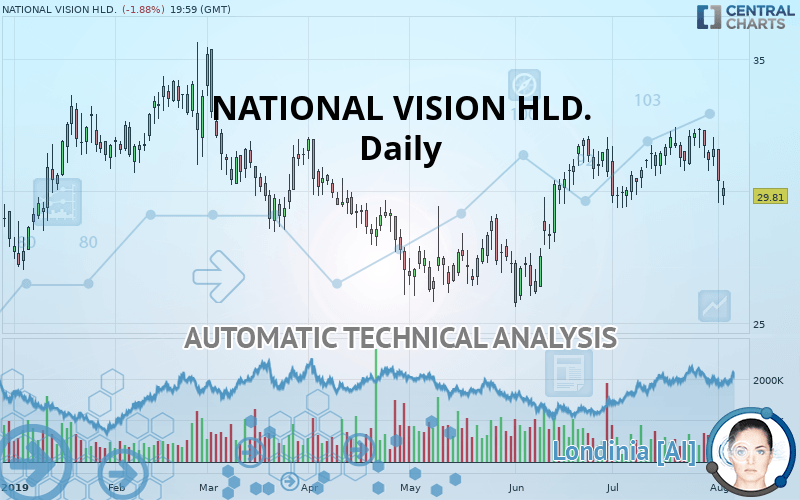
NATIONAL VISION HLD. - Daily - Technical analysis published on 08/05/2019 (GMT)
- Who voted?
- 163
- 0
Click here for a new analysis!
- Timeframe : Daily
- - Analysis generated on
- Status : TARGET REACHED
Summary of the analysis

Additional analysis
Quotes
NATIONAL VISION HLD. rating 29.81 USD. The price registered a decrease of -1.88% on the session and was between 29.46 USD and 30.39 USD. This implies that the price is at +1.19% from its lowest and at -1.91% from its highest.A bearish opening was detected by the Central Gaps scanner. Sellers are trying to impose a bearish trend in the very short term.
Bearish opening
Type : Bearish
Timeframe : Openning
A study of price movements over other periods shows the following variations:
Near a new LOW record (1 month)
Type : Bearish
Timeframe : Weekly
Technical
Technical analysis of this Daily chart of NATIONAL VISION HLD. indicates that the overall trend is bearish. 64.29% of the signals given by moving averages are bearish. This bearish trend is supported by the strong bearish signals given by short-term moving averages. The Central Indicators scanner detects bearish signals on moving averages that could impact this trend:
Bearish trend reversal : Moving Average 100
Type : Bearish
Timeframe : Daily
Bearish trend reversal : adaptative moving average 50
Type : Bearish
Timeframe : Daily
Bearish trend reversal : adaptative moving average 100
Type : Bearish
Timeframe : Daily
Bearish price crossover with Moving Average 20
Type : Bearish
Timeframe : Daily
An assessment of technical indicators shows a bearish signal.
Central Indicators, the detector scanner for these technical indicators has recently detected several signals:
Pivot points : price is under support 3
Type : Neutral
Timeframe : Weekly
RSI indicator is back under 50
Type : Bearish
Timeframe : Daily
Price is back over the pivot point
Type : Bullish
Timeframe : Weekly
Price is back under the pivot point
Type : Bearish
Timeframe : Daily
Momentum indicator is back under 0
Type : Bearish
Timeframe : Daily
Williams %R indicator is back under -50
Type : Bearish
Timeframe : Daily
An analysis of the price chart with the Central Patterns scanner (detector of chart patterns and resistances and supports) shows a result that can have an impact on the price change:
Near support of channel
Type : Bullish
Timeframe : Daily
The Central Candlesticks scanner, specialised in Japanese candlesticks, did not identify any signals.
| S2 | S1 | Price | R1 | R2 | R3 | |
|---|---|---|---|---|---|---|
| ProTrendLines | 26.44 | 28.91 | 29.81 | 31.97 | 35.19 | 38.33 |
| Change (%) | -11.30% | -3.02% | - | +7.25% | +18.05% | +28.58% |
| Change | -3.37 | -0.90 | - | +2.16 | +5.38 | +8.52 |
| Level | Intermediate | Minor | - | Major | Intermediate | Minor |
Pivot points can also be used to set your price objectives. Here is the price situation in relation to pivot points:
| Pivot points | S3 | S2 | S1 | PP | R1 | R2 | R3 |
|---|---|---|---|---|---|---|---|
| Standard | 27.38 | 28.47 | 29.42 | 30.51 | 31.46 | 32.55 | 33.50 |
| Camarilla | 29.82 | 30.01 | 30.19 | 30.38 | 30.57 | 30.75 | 30.94 |
| Woodie | 27.32 | 28.44 | 29.36 | 30.48 | 31.40 | 32.52 | 33.44 |
| Fibonacci | 28.47 | 29.25 | 29.73 | 30.51 | 31.29 | 31.77 | 32.55 |
| Pivot points | S3 | S2 | S1 | PP | R1 | R2 | R3 |
|---|---|---|---|---|---|---|---|
| Standard | 29.62 | 30.19 | 31.26 | 31.83 | 32.90 | 33.47 | 34.54 |
| Camarilla | 31.89 | 32.04 | 32.19 | 32.34 | 32.49 | 32.64 | 32.79 |
| Woodie | 29.88 | 30.32 | 31.52 | 31.96 | 33.16 | 33.60 | 34.80 |
| Fibonacci | 30.19 | 30.81 | 31.20 | 31.83 | 32.45 | 32.84 | 33.47 |
| Pivot points | S3 | S2 | S1 | PP | R1 | R2 | R3 |
|---|---|---|---|---|---|---|---|
| Standard | 26.71 | 28.03 | 29.81 | 31.13 | 32.91 | 34.23 | 36.01 |
| Camarilla | 30.74 | 31.02 | 31.31 | 31.59 | 31.87 | 32.16 | 32.44 |
| Woodie | 26.94 | 28.15 | 30.04 | 31.25 | 33.14 | 34.35 | 36.24 |
| Fibonacci | 28.03 | 29.21 | 29.95 | 31.13 | 32.31 | 33.05 | 34.23 |
Numerical data
The following is the status of technical indicators and moving averages registered at the time this technical analysis was created:
| RSI (14): | 41.22 | |
| MACD (12,26,9): | 0.1900 | |
| Directional Movement: | -4.11 | |
| AROON (14): | -71.43 | |
| DEMA (21): | 31.48 | |
| Parabolic SAR (0,02-0,02-0,2): | 32.27 | |
| Elder Ray (13): | -1.23 | |
| Super Trend (3,10): | 29.30 | |
| Zig ZAG (10): | 29.81 | |
| VORTEX (21): | 0.9900 | |
| Stochastique (14,3,5): | 31.61 | |
| TEMA (21): | 31.17 | |
| Williams %R (14): | -88.29 | |
| Chande Momentum Oscillator (20): | -1.88 | |
| Repulse (5,40,3): | -3.1300 | |
| ROCnROLL: | 2 | |
| TRIX (15,9): | 0.2200 | |
| Courbe Coppock: | 0.80 |
| MA7: | 31.32 | |
| MA20: | 31.29 | |
| MA50: | 30.03 | |
| MA100: | 29.46 | |
| MAexp7: | 30.95 | |
| MAexp20: | 31.09 | |
| MAexp50: | 30.43 | |
| MAexp100: | 30.48 | |
| Price / MA7: | -4.82% | |
| Price / MA20: | -4.73% | |
| Price / MA50: | -0.73% | |
| Price / MA100: | +1.19% | |
| Price / MAexp7: | -3.68% | |
| Price / MAexp20: | -4.12% | |
| Price / MAexp50: | -2.04% | |
| Price / MAexp100: | -2.20% |
News
The last news published on NATIONAL VISION HLD. at the time of the generation of this analysis was as follows:
- National Vision Holdings, Inc. Announces Second Quarter 2019 Earnings Release and Conference Call
- National Vision Holdings, Inc. Appoints Heather Cianfrocco to Board of Directors
- National Vision Welcomes Melissa Rasmussen as Chief Accounting Officer
- National Vision Welcomes Bill Clark as its First “Chief People Officer”
- Eyeglass World Launches New Philanthropic Outreach Program
About author

Online


Add a comment
Comments
0 comments on the analysis NATIONAL VISION HLD. - Daily