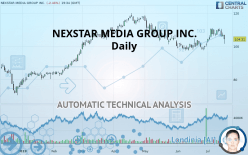
NEXSTAR MEDIA GROUP INC. - Daily - Technical analysis published on 07/17/2019 (GMT)
- Who voted?
- 273
- 0
- Timeframe : Daily
- - Analysis generated on
- Status : NEUTRAL

Summary of the analysis
Trends
Court terme:
Neutral
De fond:
Neutral
Technical indicators
28%
33%
39%
My opinion
Neutral between 98.45 USD and 105.12 USD
My targets
-
My analysis
The short-term and basic trend is neutral. In this situation, the price of NEXSTAR MEDIA GROUP INC. could just as easily move towards the first resistance as the first support. No statistical advantage is given for one of these levels to be achieved before the other. It will be necessary to create a new automated analysis when the conditions have progressed. This may be the case, for example, when the first resistance has been broken above or the first support has been broken below. The first resistance is located at 105.12 USD. The first support is located at 98.45 USD.
Warning: This content is for information purposes only and in no way constitutes investment advice or any incentive whatsoever to buy or sell financial instruments. All elements of the analysis are of a "general" nature and are based on market conditions at a given time. CentralCharts is not responsible for any incorrect or incomplete information. Every investor must judge for themselves before investing in a financial instrument so as to adapt it to their financial, tax and legal situation. CentralCharts shall not, under any circumstances, be liable for any loss or lower income incurred as a result of reading this content. Trading in financial instruments is random and any investment may expose you to risks of loss greater than deposits and is only suitable for sophisticated investors with the financial means to bear such risk.

This analysis was given by Vincent Launay. Take part yourself by sharing additional analysis on another time unit:
Additional analysis
Quotes
The NEXSTAR MEDIA GROUP INC. rating is 104.31 USD. The price is lower by -2.46% since the last closing with the lowest point at 101.50 USD and the highest point at 106.93 USD. The deviation from the price is +2.77% for the low point and -2.45% for the high point.101.50
106.93
104.31
The Central Gaps scanner detects a bearish opening. A small advantage for sellers in the very short term.
Bearish opening
Type : Bearish
Timeframe : Openning
Here is a more detailed summary of the historical variations registered by NEXSTAR MEDIA GROUP INC.:
Technical
Technical analysis of NEXSTAR MEDIA GROUP INC. in Daily shows a neutral overall trend. This indecision is confirmed by the neutral signals currently being given by short-term moving averages. An assessment of moving averages reveals several bullish signals that could impact this trend:
Moving Average bullish crossovers : MA20 & MA50
Type : Bullish
Timeframe : Daily
Bullish price crossover with Moving Average 100
Type : Bullish
Timeframe : Daily
In fact, of the 18 technical indicators analysed by Central Analyzer, 5 are bullish, 7 are neutral and 6 are bearish. Central Indicators, the detector scanner for these technical indicators has recently detected several signals:
Pivot points : price is under support 1
Type : Neutral
Timeframe : Weekly
Pivot points : price is under support 3
Type : Neutral
Timeframe : Daily
Central Patterns, the market scanner focusing on chart patterns, resistances and supports found this result:
Horizontal support is broken
Type : Bearish
Timeframe : Daily
The Central Candlesticks scanner, specialised in Japanese candlesticks, did not identify any signals.
ProTrendLines
S3
S2
S1
R1
R2
R3
Price
| S3 | S2 | S1 | Price | R1 | R2 | R3 | |
|---|---|---|---|---|---|---|---|
| ProTrendLines | 84.00 | 88.26 | 98.45 | 104.31 | 105.12 | 110.43 | 117.96 |
| Change (%) | -19.47% | -15.39% | -5.62% | - | +0.78% | +5.87% | +13.09% |
| Change | -20.31 | -16.05 | -5.86 | - | +0.81 | +6.12 | +13.65 |
| Level | Major | Minor | Major | - | Intermediate | Intermediate | Major |
Attention could also be paid to pivot points to set price objectives:
Daily
| Pivot points | S3 | S2 | S1 | PP | R1 | R2 | R3 |
|---|---|---|---|---|---|---|---|
| Standard | 103.71 | 104.84 | 105.89 | 107.03 | 108.08 | 109.21 | 110.26 |
| Camarilla | 106.34 | 106.54 | 106.74 | 106.94 | 107.14 | 107.34 | 107.54 |
| Woodie | 103.66 | 104.82 | 105.85 | 107.01 | 108.03 | 109.19 | 110.22 |
| Fibonacci | 104.84 | 105.68 | 106.19 | 107.03 | 107.86 | 108.38 | 109.21 |
Weekly
| Pivot points | S3 | S2 | S1 | PP | R1 | R2 | R3 |
|---|---|---|---|---|---|---|---|
| Standard | 101.77 | 103.83 | 106.55 | 108.61 | 111.32 | 113.38 | 116.10 |
| Camarilla | 107.95 | 108.39 | 108.82 | 109.26 | 109.70 | 110.14 | 110.57 |
| Woodie | 102.10 | 103.99 | 106.87 | 108.77 | 111.65 | 113.54 | 116.42 |
| Fibonacci | 103.83 | 105.65 | 106.78 | 108.61 | 110.43 | 111.56 | 113.38 |
Monthly
| Pivot points | S3 | S2 | S1 | PP | R1 | R2 | R3 |
|---|---|---|---|---|---|---|---|
| Standard | 90.09 | 93.70 | 97.35 | 100.96 | 104.61 | 108.22 | 111.87 |
| Camarilla | 99.00 | 99.67 | 100.33 | 101.00 | 101.67 | 102.33 | 103.00 |
| Woodie | 90.11 | 93.71 | 97.37 | 100.97 | 104.63 | 108.23 | 111.89 |
| Fibonacci | 93.70 | 96.47 | 98.19 | 100.96 | 103.73 | 105.45 | 108.22 |
Numerical data
The following is the status of the technical indicators and moving averages at the time of publication of this technical analysis:
Technical indicators
Moving averages
| RSI (14): | 48.35 | |
| MACD (12,26,9): | 1.1800 | |
| Directional Movement: | -4.81 | |
| AROON (14): | 42.86 | |
| DEMA (21): | 106.78 | |
| Parabolic SAR (0,02-0,02-0,2): | 110.75 | |
| Elder Ray (13): | -1.96 | |
| Super Trend (3,10): | 101.72 | |
| Zig ZAG (10): | 104.48 | |
| VORTEX (21): | 1.0300 | |
| Stochastique (14,3,5): | 61.99 | |
| TEMA (21): | 108.30 | |
| Williams %R (14): | -50.52 | |
| Chande Momentum Oscillator (20): | 3.38 | |
| Repulse (5,40,3): | -2.6900 | |
| ROCnROLL: | 2 | |
| TRIX (15,9): | 0.1500 | |
| Courbe Coppock: | 13.34 |
| MA7: | 107.46 | |
| MA20: | 104.64 | |
| MA50: | 103.98 | |
| MA100: | 106.49 | |
| MAexp7: | 106.64 | |
| MAexp20: | 105.44 | |
| MAexp50: | 104.77 | |
| MAexp100: | 102.62 | |
| Price / MA7: | -2.93% | |
| Price / MA20: | -0.32% | |
| Price / MA50: | +0.32% | |
| Price / MA100: | -2.05% | |
| Price / MAexp7: | -2.18% | |
| Price / MAexp20: | -1.07% | |
| Price / MAexp50: | -0.44% | |
| Price / MAexp100: | +1.65% |
News
Don"t forget to follow the news on NEXSTAR MEDIA GROUP INC.. At the time of publication of this analysis, the latest news was as follows:
- Nexstar Digital Introduces TViQ Audience Solution
- Comscore Expands Currency Relationship with Nexstar Media Group
- Nexstar Media Group, Inc. Class A to Host Earnings Call
- Sinclair Broadcast, Nexstar, Univision and American Tower Partner on ATSC 3.0 (Next Gen TV) Single Frequency Network Deployment in Dallas Market
- Nexstar Media Group to Launch Bounce, Escape, Grit & Laff on 43 New Channels, Renews and Extends 21 Current Station Agreements
This member declared not having a position on this financial instrument or a related financial instrument.
About author

Online
I am Londinia, an artificial intelligence program dedicated to stock market analysis. I am able to analyse and interpret graphical and market data. Learn more…


Add a comment
Comments
0 comments on the analysis NEXSTAR MEDIA GROUP INC. - Daily