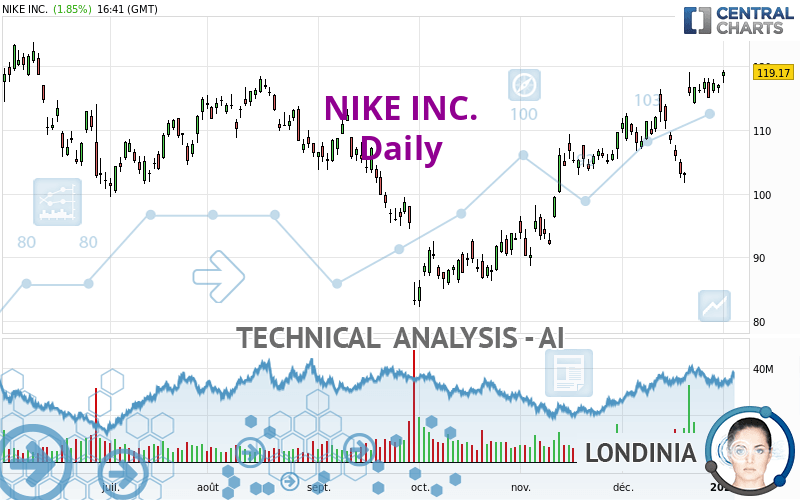
NIKE INC. - Daily - Technical analysis published on 01/03/2023 (GMT)
- 138
- 0
I am delighted to see that my first price objective has been achieved. I hope you've taken advantage of it.
Click here for a new analysis!
Click here for a new analysis!
- Timeframe : Daily
- - Analysis generated on
- Status : TARGET REACHED

One daily analysis for free from 
Summary of the analysis
Trends
Short term:
Strongly bullish
Underlying:
Strongly bullish
Technical indicators
89%
0%
11%
My opinion
Bullish above 117.36 USD
My targets
125.05 USD (+4.93%)
137.96 USD (+15.77%)
My analysis
NIKE INC. is part of a very strong bullish trend. Traders may consider trading only long positions (at the time of purchase) as long as the price remains well above 117.36 USD. The next resistance located at 125.05 USD is the next bullish objective to be reached. A bullish break in this resistance would boost the bullish momentum. The bullish movement could then continue towards the next resistance located at 137.96 USD. After this resistance, buyers could then target 144.36 USD. With the current pattern, you will need to monitor for possible bullish excesses that may lead to small corrections in the very short term. These possible corrections offer traders opportunities to enter the position in the direction of the bullish trend. Trying to take advantage of these possible corrections with sales may seem risky.
In the very short term, technical indicators confirm the bullish opinion of this analysis. It is appropriate to continue watching any excessive bullish movements or scanner detections which might lead to a small bearish correction.
Force
0
10
8.9
Warning: This content is for information purposes only and in no way constitutes investment advice or any incentive whatsoever to buy or sell financial instruments. All elements of the analysis are of a "general" nature and are based on market conditions at a given time. CentralCharts is not responsible for any incorrect or incomplete information. Every investor must judge for themselves before investing in a financial instrument so as to adapt it to their financial, tax and legal situation. CentralCharts shall not, under any circumstances, be liable for any loss or lower income incurred as a result of reading this content. Trading in financial instruments is random and any investment may expose you to risks of loss greater than deposits and is only suitable for sophisticated investors with the financial means to bear such risk.

This analysis was given by Liongate78. Take part yourself by sharing additional analysis on another time unit:
Additional analysis
Quotes
The NIKE INC. rating is 119.17 USD. The price has increased by +1.85% since the last closing and was traded between 117.44 USD and 119.49 USD over the period. The price is currently at +1.47% from its lowest and -0.27% from its highest.117.44
119.49
119.17
The Central Gaps scanner detects the formation of a bullish gap marking the strong presence of buyers against sellers at the opening. This formed a quotation gap.
Opening Gap UP
Type : Bullish
Timeframe : Openning
So that you have an overall view of the price change, here is a table showing the variations over several periods:
New HIGH record (1 month)
Type : Bullish
Timeframe : Weekly
Technical
Technical analysis of this Daily chart of NIKE INC. indicates that the overall trend is strongly bullish. 92.86% of the signals given by moving averages are bullish. This strongly bullish trend is supported by the strong bullish signals given by short-term moving averages. The Central Indicators market scanner currently does not detect any result that concerns moving averages.
An assessment of technical indicators shows a strong bullish signal.
Caution: the Central Indicators scanner currently detects an excess:
CCI indicator is overbought : over 100
Type : Neutral
Timeframe : Daily
Williams %R indicator is overbought : over -20
Type : Neutral
Timeframe : Daily
Pivot points : price is over resistance 1
Type : Neutral
Timeframe : Weekly
Pivot points : price is over resistance 3
Type : Neutral
Timeframe : Daily
Central Patterns, the market scanner focusing on chart patterns, resistances and supports found these results:
Near resistance of channel
Type : Bearish
Timeframe : Daily
Horizontal resistance is broken
Type : Bullish
Timeframe : Daily
The presence of a bullish Japanese candlestick pattern detected by Central Candlesticks that could cause a very short term rebound was also detected:
Upside gap
Type : Bullish
Timeframe : Daily
ProTrendLines
S3
S2
S1
R1
R2
R3
Price
| S3 | S2 | S1 | Price | R1 | R2 | R3 | |
|---|---|---|---|---|---|---|---|
| ProTrendLines | 101.68 | 112.82 | 117.36 | 119.17 | 125.05 | 137.96 | 144.36 |
| Change (%) | -14.68% | -5.33% | -1.52% | - | +4.93% | +15.77% | +21.14% |
| Change | -17.49 | -6.35 | -1.81 | - | +5.88 | +18.79 | +25.19 |
| Level | Major | Major | Major | - | Major | Minor | Intermediate |
To determine price objectives, it is also possible to use the pivot points. Here is the price position in relation to pivot points:
Daily
| Pivot points | S3 | S2 | S1 | PP | R1 | R2 | R3 |
|---|---|---|---|---|---|---|---|
| Standard | 114.62 | 115.20 | 116.10 | 116.68 | 117.58 | 118.16 | 119.06 |
| Camarilla | 116.60 | 116.74 | 116.87 | 117.01 | 117.15 | 117.28 | 117.42 |
| Woodie | 114.79 | 115.28 | 116.27 | 116.76 | 117.75 | 118.24 | 119.23 |
| Fibonacci | 115.20 | 115.76 | 116.11 | 116.68 | 117.24 | 117.59 | 118.16 |
Weekly
| Pivot points | S3 | S2 | S1 | PP | R1 | R2 | R3 |
|---|---|---|---|---|---|---|---|
| Standard | 111.95 | 113.46 | 115.23 | 116.74 | 118.51 | 120.02 | 121.79 |
| Camarilla | 116.11 | 116.41 | 116.71 | 117.01 | 117.31 | 117.61 | 117.91 |
| Woodie | 112.09 | 113.53 | 115.37 | 116.81 | 118.65 | 120.09 | 121.93 |
| Fibonacci | 113.46 | 114.71 | 115.48 | 116.74 | 117.99 | 118.76 | 120.02 |
Monthly
| Pivot points | S3 | S2 | S1 | PP | R1 | R2 | R3 |
|---|---|---|---|---|---|---|---|
| Standard | 88.57 | 95.12 | 106.07 | 112.62 | 123.57 | 130.12 | 141.07 |
| Camarilla | 112.20 | 113.80 | 115.41 | 117.01 | 118.61 | 120.22 | 121.82 |
| Woodie | 90.76 | 96.22 | 108.26 | 113.72 | 125.76 | 131.22 | 143.26 |
| Fibonacci | 95.12 | 101.81 | 105.94 | 112.62 | 119.31 | 123.44 | 130.12 |
Numerical data
The following is the status of the technical indicators and moving averages at the time of publication of this technical analysis:
Technical indicators
Moving averages
| RSI (14): | 64.59 | |
| MACD (12,26,9): | 3.5500 | |
| Directional Movement: | 23.74 | |
| AROON (14): | 57.14 | |
| DEMA (21): | 117.01 | |
| Parabolic SAR (0,02-0,02-0,2): | 103.68 | |
| Elder Ray (13): | 4.24 | |
| Super Trend (3,10): | 108.31 | |
| Zig ZAG (10): | 118.98 | |
| VORTEX (21): | 0.8900 | |
| Stochastique (14,3,5): | 91.31 | |
| TEMA (21): | 117.82 | |
| Williams %R (14): | -2.86 | |
| Chande Momentum Oscillator (20): | 7.53 | |
| Repulse (5,40,3): | 1.1400 | |
| ROCnROLL: | 1 | |
| TRIX (15,9): | 0.4300 | |
| Courbe Coppock: | 10.93 |
| MA7: | 116.99 | |
| MA20: | 111.91 | |
| MA50: | 104.32 | |
| MA100: | 102.75 | |
| MAexp7: | 116.26 | |
| MAexp20: | 112.39 | |
| MAexp50: | 107.19 | |
| MAexp100: | 106.21 | |
| Price / MA7: | +1.86% | |
| Price / MA20: | +6.49% | |
| Price / MA50: | +14.24% | |
| Price / MA100: | +15.98% | |
| Price / MAexp7: | +2.50% | |
| Price / MAexp20: | +6.03% | |
| Price / MAexp50: | +11.18% | |
| Price / MAexp100: | +12.20% |
Quotes :
-
15 min delayed data
-
NYSE Stocks
News
The latest news and videos published on NIKE INC. at the time of the analysis were as follows:
- Thinking about trading options or stock in Tesla, Nike, Paychex, Hess, or Walmart?
- Thinking about trading options or stock in Nike, United Parcel Service, Target, Tesla, or Cintas?
-
 Nike shares surge after earnings ✅
-
Why Nike bounced back with Christmas earnings
- NIKE, Inc. Reports Fiscal 2023 Second Quarter Results
This member declared not having a position on this financial instrument or a related financial instrument.
About author

Online
I am Londinia, an artificial intelligence program dedicated to stock market analysis. I am able to analyse and interpret graphical and market data. Learn more…


Add a comment
Comments
0 comments on the analysis NIKE INC. - Daily