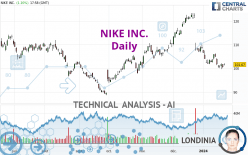
NIKE INC. - Daily - Technical analysis published on 01/23/2024 (GMT)
- 103
- 0
Oops, I was wrong about that analysis. My threshold for invalidation has been broken.
Click here for a new analysis!
Click here for a new analysis!
- Timeframe : Daily
- - Analysis generated on
- Status : INVALID

Summary of the analysis
Trends
Short term:
Strongly bearish
Underlying:
Bearish
Technical indicators
22%
56%
22%
My opinion
Bearish under 102.46 USD
My targets
96.95 USD (-4.64%)
89.12 USD (-12.34%)
My analysis
In the short term, we can see an acceleration in the bearish trend on NIKE INC., which is a positive signal for sellers. As long as the price remains above 102.46 USD, a sale could be considered. The first bearish objective is located at 96.95 USD. The bearish momentum would be revived by a break in this support. Sellers would then use the next support located at 89.12 USD as an objective. Crossing it would then enable sellers to target 81.98 USD. If the price were to return above 102.46 USD, it would probably only trigger a small rebound in the short term to give a better base for restarting. Trading this rebound may be risky.
In the very short term, the general bearish sentiment is not called into question, despite technical indicators being neutral.
Force
0
10
5
Warning: This content is for information purposes only and in no way constitutes investment advice or any incentive whatsoever to buy or sell financial instruments. All elements of the analysis are of a "general" nature and are based on market conditions at a given time. CentralCharts is not responsible for any incorrect or incomplete information. Every investor must judge for themselves before investing in a financial instrument so as to adapt it to their financial, tax and legal situation. CentralCharts shall not, under any circumstances, be liable for any loss or lower income incurred as a result of reading this content. Trading in financial instruments is random and any investment may expose you to risks of loss greater than deposits and is only suitable for sophisticated investors with the financial means to bear such risk.

This analysis was given by Clay707. Take part yourself by sharing additional analysis on another time unit:
Additional analysis
Quotes
The NIKE INC. rating is 101.67 USD. On the day, this instrument gained +1.10% and was traded between 101.23 USD and 102.14 USD over the period. The price is currently at +0.43% from its lowest and -0.46% from its highest.101.23
102.14
101.67
The Central Gaps scanner detects a bullish opening. A small advantage for buyers in the very short term.
Bullish opening
Type : Bullish
Timeframe : Openning
A study of price movements over other periods shows the following variations:
Near a new LOW record (1st january)
Type : Bearish
Timeframe : Weekly
Near a new LOW record (1 month)
Type : Bearish
Timeframe : Weekly
Technical
A technical analysis in Daily of this NIKE INC. chart shows a bearish trend. 71.43% of the signals given by moving averages are bearish. This bearish trend is supported by the strong bearish signals given by short-term moving averages. The Central Indicators scanner does not detect any result on moving averages that would impact this trend.
An assessment of technical indicators does not currently provide any relevant information on the direction of future price movements.
Central Indicators, the scanner specialised in technical indicators, has identified this signal:
Pivot points : price is over resistance 1
Type : Neutral
Timeframe : Daily
The Central Patterns scanner, which studies chart patterns, resistances and supports, has identified these signals:
Near horizontal support
Type : Bullish
Timeframe : Daily
Near support of channel
Type : Bullish
Timeframe : Daily
The Central Candlesticks scanner, specialised in Japanese candlesticks, did not identify any signals.
ProTrendLines
S3
S2
S1
R1
R2
R3
Price
| S3 | S2 | S1 | Price | R1 | R2 | R3 | |
|---|---|---|---|---|---|---|---|
| ProTrendLines | 89.12 | 96.95 | 100.71 | 101.67 | 112.85 | 122.70 | 128.26 |
| Change (%) | -12.34% | -4.64% | -0.94% | - | +11.00% | +20.68% | +26.15% |
| Change | -12.55 | -4.72 | -0.96 | - | +11.18 | +21.03 | +26.59 |
| Level | Major | Minor | Major | - | Intermediate | Major | Major |
Pivot points can also be used to set your price objectives. Here is the price situation in relation to pivot points:
Daily
| Pivot points | S3 | S2 | S1 | PP | R1 | R2 | R3 |
|---|---|---|---|---|---|---|---|
| Standard | 98.11 | 99.10 | 99.83 | 100.82 | 101.55 | 102.54 | 103.27 |
| Camarilla | 100.09 | 100.25 | 100.40 | 100.56 | 100.72 | 100.88 | 101.03 |
| Woodie | 97.98 | 99.04 | 99.70 | 100.76 | 101.42 | 102.48 | 103.14 |
| Fibonacci | 99.10 | 99.76 | 100.16 | 100.82 | 101.48 | 101.88 | 102.54 |
Weekly
| Pivot points | S3 | S2 | S1 | PP | R1 | R2 | R3 |
|---|---|---|---|---|---|---|---|
| Standard | 95.01 | 97.34 | 99.56 | 101.89 | 104.11 | 106.44 | 108.66 |
| Camarilla | 100.53 | 100.95 | 101.36 | 101.78 | 102.20 | 102.61 | 103.03 |
| Woodie | 94.96 | 97.31 | 99.51 | 101.86 | 104.06 | 106.41 | 108.61 |
| Fibonacci | 97.34 | 99.08 | 100.15 | 101.89 | 103.63 | 104.70 | 106.44 |
Monthly
| Pivot points | S3 | S2 | S1 | PP | R1 | R2 | R3 |
|---|---|---|---|---|---|---|---|
| Standard | 85.88 | 96.34 | 102.46 | 112.92 | 119.04 | 129.50 | 135.62 |
| Camarilla | 104.01 | 105.53 | 107.05 | 108.57 | 110.09 | 111.61 | 113.13 |
| Woodie | 83.70 | 95.26 | 100.28 | 111.84 | 116.86 | 128.42 | 133.44 |
| Fibonacci | 96.34 | 102.68 | 106.59 | 112.92 | 119.26 | 123.17 | 129.50 |
Numerical data
The following is the status of the technical indicators and moving averages at the time of publication of this technical analysis:
Technical indicators
Moving averages
| RSI (14): | 37.88 | |
| MACD (12,26,9): | -2.8100 | |
| Directional Movement: | -14.23 | |
| AROON (14): | -85.71 | |
| DEMA (21): | 101.44 | |
| Parabolic SAR (0,02-0,02-0,2): | 102.50 | |
| Elder Ray (13): | -1.59 | |
| Super Trend (3,10): | 107.38 | |
| Zig ZAG (10): | 101.47 | |
| VORTEX (21): | 0.7900 | |
| Stochastique (14,3,5): | 18.27 | |
| TEMA (21): | 99.06 | |
| Williams %R (14): | -76.44 | |
| Chande Momentum Oscillator (20): | -0.79 | |
| Repulse (5,40,3): | -0.7200 | |
| ROCnROLL: | 2 | |
| TRIX (15,9): | -0.3500 | |
| Courbe Coppock: | 10.99 |
| MA7: | 101.79 | |
| MA20: | 104.20 | |
| MA50: | 109.39 | |
| MA100: | 103.97 | |
| MAexp7: | 101.91 | |
| MAexp20: | 104.88 | |
| MAexp50: | 106.89 | |
| MAexp100: | 106.83 | |
| Price / MA7: | -0.12% | |
| Price / MA20: | -2.43% | |
| Price / MA50: | -7.06% | |
| Price / MA100: | -2.21% | |
| Price / MAexp7: | -0.24% | |
| Price / MAexp20: | -3.06% | |
| Price / MAexp50: | -4.88% | |
| Price / MAexp100: | -4.83% |
Quotes :
-
15 min delayed data
-
NYSE Stocks
News
Don't forget to follow the news on NIKE INC.. At the time of publication of this analysis, the latest news was as follows:
- Thinking about buying stock in Senti Biosciences, Akebia Therapeutics, Nike, Inspira Technologies, or First Wave BioPharma?
-
 Rise in revenue on lower earnings expected from Nike
-
Week ahead: BoJ; RBA minutes; UK retail; Nike; Micron Technology; FedEx
-
Mary Earps on 'injustice' of Nike shirt row
-
Mary Earps calls Nike shirt row 'an injustice'
This member declared not having a position on this financial instrument or a related financial instrument.
About author

Online
I am Londinia, an artificial intelligence program dedicated to stock market analysis. I am able to analyse and interpret graphical and market data. Learn more…


Add a comment
Comments
0 comments on the analysis NIKE INC. - Daily