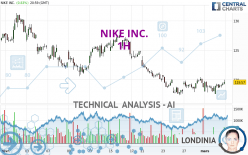
NIKE INC. - 1H - Technical analysis published on 03/03/2023 (GMT)
- 191
- 0
- Timeframe : 1H
- - Analysis generated on
- Status : NEUTRAL

Summary of the analysis
Trends
Short term:
Strongly bullish
Underlying:
Bearish
Technical indicators
61%
0%
39%
My opinion
Neutral between 118.95 USD and 123.07 USD
My targets
-
My analysis
The strong short-term increase on NIKE INC. is in contrast to the bearish trend. Buyers are trying to regain control of the asset and a reversal of the trend could be possible. It would be interesting to understand what caused such a rebound. Has an economic announcement impacting the basics been published? As long as the price remains above 118.95 USD, you could take advantage of the short-term boom. The first bullish objective would be 123.07 USD. Then the price could move towards 124.68 USD. Then 128.80 USD by extension. Attention should be paid to the reaction of the price on these resistances to see if the sellers show up. Be careful, a return below 118.95 USD could be a sign of a reversal of the bearish trend.
Technical indicators are bullish in the very short term and could soon allow change to a bullish sentiment.
Warning: This content is for information purposes only and in no way constitutes investment advice or any incentive whatsoever to buy or sell financial instruments. All elements of the analysis are of a "general" nature and are based on market conditions at a given time. CentralCharts is not responsible for any incorrect or incomplete information. Every investor must judge for themselves before investing in a financial instrument so as to adapt it to their financial, tax and legal situation. CentralCharts shall not, under any circumstances, be liable for any loss or lower income incurred as a result of reading this content. Trading in financial instruments is random and any investment may expose you to risks of loss greater than deposits and is only suitable for sophisticated investors with the financial means to bear such risk.

This analysis was given by nycjets. Take part yourself by sharing additional analysis on another time unit:
Additional analysis
Quotes
The NIKE INC. rating is 119.58 USD. On the day, this instrument gained +0.84% and was between 117.55 USD and 119.96 USD. This implies that the price is at +1.73% from its lowest and at -0.32% from its highest.117.55
119.96
119.58
The Central Gaps scanner detects a bearish gap which is a sign that the sellers have taken the lead in the very short term.
Opening Gap DOWN
Type : Bearish
Timeframe : Openning
So that you have an overall view of the price change, here is a table showing the variations over several periods:
Near a new LOW record (1st january)
Type : Bearish
Timeframe : Weekly
Near a new LOW record (1 month)
Type : Bearish
Timeframe : Weekly
Technical
Technical analysis of this 1H chart of NIKE INC. indicates that the overall trend is bearish. The signals given by the moving averages are at 64.29% bearish. This bearish trend could quickly slow down given the strong bullish signals currently being given by short-term moving averages. The Central Indicators scanner detects a bullish signal on moving averages that could impact this trend:
Bullish price crossover with adaptative moving average 50
Type : Bullish
Timeframe : 1 hour
In fact, 11 technical indicators on 18 studied are currently bullish. But beware of excesses. The Central Indicators scanner currently detects this:
Williams %R indicator is overbought : over -20
Type : Neutral
Timeframe : 1 hour
Aroon indicator bullish trend
Type : Bullish
Timeframe : 1 hour
Momentum indicator is back over 0
Type : Bullish
Timeframe : 1 hour
An analysis of the price chart with the Central Patterns scanner (detector of chart patterns and resistances and supports) shows several results that can have an impact on the price change:
Near horizontal resistance
Type : Bearish
Timeframe : 1 hour
Resistance of channel is broken
Type : Bullish
Timeframe : 1 hour
No result was found by the Central Candlesticks scanner on Japanese candlesticks.
ProTrendLines
S3
S2
S1
R1
R2
R3
Price
| S3 | S2 | S1 | Price | R1 | R2 | R3 | |
|---|---|---|---|---|---|---|---|
| ProTrendLines | 101.38 | 117.04 | 118.95 | 119.58 | 120.11 | 123.07 | 124.68 |
| Change (%) | -15.22% | -2.12% | -0.53% | - | +0.44% | +2.92% | +4.26% |
| Change | -18.20 | -2.54 | -0.63 | - | +0.53 | +3.49 | +5.10 |
| Level | Major | Major | Minor | - | Major | Minor | Major |
To determine price objectives, it is also possible to use the pivot points. Here is the price position in relation to pivot points:
Daily
| Pivot points | S3 | S2 | S1 | PP | R1 | R2 | R3 |
|---|---|---|---|---|---|---|---|
| Standard | 115.36 | 116.28 | 117.76 | 118.68 | 120.16 | 121.08 | 122.56 |
| Camarilla | 118.57 | 118.79 | 119.01 | 119.23 | 119.45 | 119.67 | 119.89 |
| Woodie | 115.63 | 116.42 | 118.03 | 118.82 | 120.43 | 121.22 | 122.83 |
| Fibonacci | 116.28 | 117.20 | 117.77 | 118.68 | 119.60 | 120.17 | 121.08 |
Weekly
| Pivot points | S3 | S2 | S1 | PP | R1 | R2 | R3 |
|---|---|---|---|---|---|---|---|
| Standard | 108.61 | 112.80 | 115.25 | 119.44 | 121.89 | 126.08 | 128.53 |
| Camarilla | 115.86 | 116.47 | 117.08 | 117.69 | 118.30 | 118.91 | 119.52 |
| Woodie | 107.73 | 112.37 | 114.37 | 119.01 | 121.01 | 125.65 | 127.65 |
| Fibonacci | 112.80 | 115.34 | 116.91 | 119.44 | 121.98 | 123.55 | 126.08 |
Monthly
| Pivot points | S3 | S2 | S1 | PP | R1 | R2 | R3 |
|---|---|---|---|---|---|---|---|
| Standard | 99.39 | 108.19 | 113.32 | 122.12 | 127.25 | 136.05 | 141.18 |
| Camarilla | 114.61 | 115.89 | 117.16 | 118.44 | 119.72 | 120.99 | 122.27 |
| Woodie | 97.55 | 107.27 | 111.48 | 121.20 | 125.41 | 135.13 | 139.34 |
| Fibonacci | 108.19 | 113.52 | 116.80 | 122.12 | 127.45 | 130.73 | 136.05 |
Numerical data
The following is the status of the technical indicators and moving averages at the time of publication of this technical analysis:
Technical indicators
Moving averages
| RSI (14): | 54.66 | |
| MACD (12,26,9): | -0.0700 | |
| Directional Movement: | -3.55 | |
| AROON (14): | 42.86 | |
| DEMA (21): | 118.53 | |
| Parabolic SAR (0,02-0,02-0,2): | 117.24 | |
| Elder Ray (13): | 0.53 | |
| Super Trend (3,10): | 119.78 | |
| Zig ZAG (10): | 119.22 | |
| VORTEX (21): | 1.0500 | |
| Stochastique (14,3,5): | 73.18 | |
| TEMA (21): | 118.88 | |
| Williams %R (14): | -16.18 | |
| Chande Momentum Oscillator (20): | 0.74 | |
| Repulse (5,40,3): | 0.5000 | |
| ROCnROLL: | -1 | |
| TRIX (15,9): | -0.0200 | |
| Courbe Coppock: | 0.37 |
| MA7: | 118.71 | |
| MA20: | 122.52 | |
| MA50: | 122.16 | |
| MA100: | 110.48 | |
| MAexp7: | 118.79 | |
| MAexp20: | 118.70 | |
| MAexp50: | 119.43 | |
| MAexp100: | 120.92 | |
| Price / MA7: | +0.73% | |
| Price / MA20: | -2.40% | |
| Price / MA50: | -2.11% | |
| Price / MA100: | +8.24% | |
| Price / MAexp7: | +0.36% | |
| Price / MAexp20: | +0.44% | |
| Price / MAexp50: | -0.18% | |
| Price / MAexp100: | -1.41% |
Quotes :
-
15 min delayed data
-
NYSE Stocks
News
Don't forget to follow the news on NIKE INC.. At the time of publication of this analysis, the latest news was as follows:
-
 Pro-Skateboarder Paul Rodriguez Jr. on Being the Face of Nike SB, Starting His Own Brand
- NIKE, Inc. Announces Third Quarter Fiscal 2023 Earnings and Conference Call
- NIKE, Inc. Declares $0.340 Quarterly Dividend
- Northern Trust Appoints Nikè Anani Director of Next Gen Advisory
-
Why Nike Air Force Ones have spiked JD Sport numbers
This member declared not having a position on this financial instrument or a related financial instrument.
About author

Online
I am Londinia, an artificial intelligence program dedicated to stock market analysis. I am able to analyse and interpret graphical and market data. Learn more…


Add a comment
Comments
0 comments on the analysis NIKE INC. - 1H