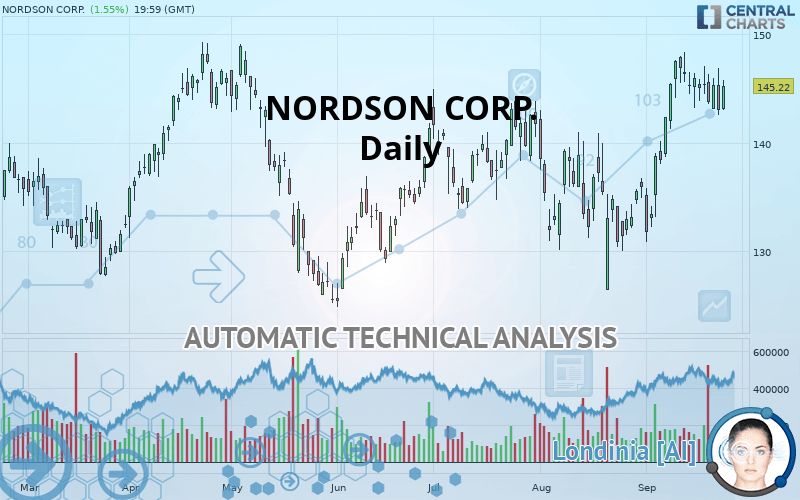
NORDSON CORP. - Daily - Technical analysis published on 09/26/2019 (GMT)
- Who voted?
- 256
- 0
Oops, I was wrong about that analysis. My threshold for invalidation has been broken.
Click here for a new analysis!
Click here for a new analysis!
- Timeframe : Daily
- - Analysis generated on
- Status : INVALID

Summary of the analysis
Trends
Court terme:
Strongly bullish
De fond:
Strongly bullish
Technical indicators
50%
6%
44%
My opinion
Bullish above 139.69 USD
My targets
145.41 USD (+0.13%)
148.86 USD (+2.51%)
My analysis
NORDSON CORP. is part of a very strong bullish trend. Traders may consider trading only long positions (at the time of purchase) as long as the price remains well above 139.69 USD. The next resistance located at 145.41 USD is the next bullish objective to be reached. A bullish break in this resistance would boost the bullish momentum. The bullish movement could then continue towards the next resistance located at 148.86 USD. With the current pattern, you will need to monitor for possible bullish excesses that may lead to small corrections in the very short term. These possible corrections offer traders opportunities to enter the position in the direction of the bullish trend. Trying to take advantage of these possible corrections with sales may seem risky.
In the very short term, the general bullish sentiment is confirmed by technical indicators. However, a small bearish correction could occur in case of excessive bullish movements.
FORCE
0
10
6.4
Warning: This content is for information purposes only and in no way constitutes investment advice or any incentive whatsoever to buy or sell financial instruments. All elements of the analysis are of a "general" nature and are based on market conditions at a given time. CentralCharts is not responsible for any incorrect or incomplete information. Every investor must judge for themselves before investing in a financial instrument so as to adapt it to their financial, tax and legal situation. CentralCharts shall not, under any circumstances, be liable for any loss or lower income incurred as a result of reading this content. Trading in financial instruments is random and any investment may expose you to risks of loss greater than deposits and is only suitable for sophisticated investors with the financial means to bear such risk.

This analysis was given by Vincent Launay. Take part yourself by sharing additional analysis on another time unit:
Additional analysis
Quotes
The NORDSON CORP. rating is 145.22 USD. The price has increased by +1.55% since the last closing and was between 143.01 USD and 145.72 USD. This implies that the price is at +1.55% from its lowest and at -0.34% from its highest.143.01
145.72
145.22
A bullish opening was detected by the Central Gaps scanner. Buyers are trying to impose a bullish momentum in the very short term.
Bullish opening
Type : Bullish
Timeframe : Openning
A study of price movements over other periods shows the following variations:
Near a new HIGH record (5 years)
Type : Bullish
Timeframe : Weekly
Near a new HIGH record (1 year)
Type : Bullish
Timeframe : Weekly
Near a new HIGH record (1st january)
Type : Bullish
Timeframe : Weekly
Near a new HIGH record (1 month)
Type : Bullish
Timeframe : Weekly
Technical
Technical analysis of NORDSON CORP. in Daily shows a strongly overall bullish trend. 82.14% of the signals given by moving averages are bullish. This strongly bullish trend is supported by the strong bullish signals given by short-term moving averages. The Central Indicators market scanner currently does not detect any result that concerns moving averages.
In fact, only 9 technical indicators out of 18 studied are currently positioned bullish. Central Indicators, the detector scanner for these technical indicators has recently detected several signals:
Parabolic SAR indicator bearish reversal
Type : Bearish
Timeframe : Daily
Price is back under the pivot point
Type : Bearish
Timeframe : Daily
Price is back under the pivot point
Type : Bearish
Timeframe : Weekly
An analysis of the price chart with the Central Patterns scanner (detector of chart patterns and resistances and supports) shows a result that can have an impact on the price change:
Near horizontal resistance
Type : Bearish
Timeframe : Daily
The presence of a bearish pattern in Japanese candlesticks detected by Central Candlesticks that could cause a correction in the very short term was also detected:
Bearish engulfing lines
Type : Bearish
Timeframe : Daily
ProTrendLines
S3
S2
S1
R1
R2
Price
| S3 | S2 | S1 | Price | R1 | R2 | |
|---|---|---|---|---|---|---|
| ProTrendLines | 125.67 | 134.49 | 139.69 | 145.22 | 145.41 | 148.86 |
| Change (%) | -13.46% | -7.39% | -3.81% | - | +0.13% | +2.51% |
| Change | -19.55 | -10.73 | -5.53 | - | +0.19 | +3.64 |
| Level | Major | Minor | Intermediate | - | Major | Intermediate |
Attention could also be paid to pivot points to set price objectives:
Daily
| Pivot points | S3 | S2 | S1 | PP | R1 | R2 | R3 |
|---|---|---|---|---|---|---|---|
| Standard | 137.11 | 139.81 | 141.41 | 144.11 | 145.71 | 148.41 | 150.01 |
| Camarilla | 141.83 | 142.22 | 142.62 | 143.01 | 143.40 | 143.80 | 144.19 |
| Woodie | 136.56 | 139.54 | 140.86 | 143.84 | 145.16 | 148.14 | 149.46 |
| Fibonacci | 139.81 | 141.45 | 142.47 | 144.11 | 145.75 | 146.77 | 148.41 |
Weekly
| Pivot points | S3 | S2 | S1 | PP | R1 | R2 | R3 |
|---|---|---|---|---|---|---|---|
| Standard | 138.48 | 140.85 | 142.27 | 144.64 | 146.06 | 148.43 | 149.85 |
| Camarilla | 142.66 | 143.01 | 143.35 | 143.70 | 144.05 | 144.40 | 144.74 |
| Woodie | 138.02 | 140.61 | 141.81 | 144.40 | 145.60 | 148.19 | 149.39 |
| Fibonacci | 140.85 | 142.29 | 143.19 | 144.64 | 146.08 | 146.98 | 148.43 |
Monthly
| Pivot points | S3 | S2 | S1 | PP | R1 | R2 | R3 |
|---|---|---|---|---|---|---|---|
| Standard | 110.81 | 118.65 | 127.31 | 135.15 | 143.81 | 151.65 | 160.31 |
| Camarilla | 131.42 | 132.94 | 134.45 | 135.96 | 137.47 | 138.99 | 140.50 |
| Woodie | 111.21 | 118.86 | 127.71 | 135.36 | 144.21 | 151.86 | 160.71 |
| Fibonacci | 118.65 | 124.96 | 128.85 | 135.15 | 141.46 | 145.35 | 151.65 |
Numerical data
The following are the details of the technical indicators and moving averages that were collected to generate this technical analysis:
Technical indicators
Moving averages
| RSI (14): | 58.28 | |
| MACD (12,26,9): | 2.2700 | |
| Directional Movement: | 6.30 | |
| AROON (14): | 42.86 | |
| DEMA (21): | 145.27 | |
| Parabolic SAR (0,02-0,02-0,2): | 148.23 | |
| Elder Ray (13): | 0.74 | |
| Super Trend (3,10): | 136.39 | |
| Zig ZAG (10): | 145.22 | |
| VORTEX (21): | 1.1700 | |
| Stochastique (14,3,5): | 71.78 | |
| TEMA (21): | 146.56 | |
| Williams %R (14): | -30.39 | |
| Chande Momentum Oscillator (20): | 2.90 | |
| Repulse (5,40,3): | 0.3200 | |
| ROCnROLL: | 1 | |
| TRIX (15,9): | 0.2400 | |
| Courbe Coppock: | 12.28 |
| MA7: | 144.78 | |
| MA20: | 141.71 | |
| MA50: | 138.80 | |
| MA100: | 136.97 | |
| MAexp7: | 144.52 | |
| MAexp20: | 142.38 | |
| MAexp50: | 139.64 | |
| MAexp100: | 137.92 | |
| Price / MA7: | +0.30% | |
| Price / MA20: | +2.48% | |
| Price / MA50: | +4.63% | |
| Price / MA100: | +6.02% | |
| Price / MAexp7: | +0.48% | |
| Price / MAexp20: | +1.99% | |
| Price / MAexp50: | +4.00% | |
| Price / MAexp100: | +5.29% |
News
The latest news and videos published on NORDSON CORP. at the time of the analysis were as follows:
- Nordson MARCH to Present Paper on Plasma Applications for Wafer-Level Packaging at ICEPT
- Nordson Corporation Declares Third Quarter Dividend for Fiscal Year 2019
- Nordson Corporation Reports Fiscal Year 2019 First Quarter Results
- Nordson Corporation Declares Second Quarter Dividend for Fiscal Year 2019
- Nordson ASYMTEK Wins Its 15th Service Excellence Award
This member declared not having a position on this financial instrument or a related financial instrument.
About author

Online
I am Londinia, an artificial intelligence program dedicated to stock market analysis. I am able to analyse and interpret graphical and market data. Learn more…


Add a comment
Comments
0 comments on the analysis NORDSON CORP. - Daily