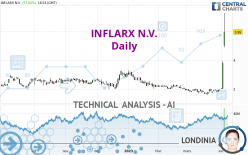
INFLARX N.V. - Daily - Technical analysis published on 04/05/2023 (GMT)
- 93
- 0
Click here for a new analysis!
- Timeframe : Daily
- - Analysis generated on
- Status : INVALID

Summary of the analysis

Additional analysis
Quotes
INFLARX N.V. rating 5.95 USD. The price has increased by +57.83% since the last closing and was between 4.88 USD and 7.25 USD. This implies that the price is at +21.93% from its lowest and at -17.93% from its highest.A bullish gap was detected at the opening by the Central Gaps scanner. There are a lot of buyers and they have the upper hand in the very short term.
Opening Gap UP
Type : Bullish
Timeframe : Openning
So that you have an overall view of the price change, here is a table showing the variations over several periods:
New HIGH record (1 year)
Type : Bullish
Timeframe : Weekly
New HIGH record (1st january)
Type : Bullish
Timeframe : Weekly
New HIGH record (1 month)
Type : Bullish
Timeframe : Weekly
Abnormal volumes on INFLARX N.V. were detected by the Central Volumes scanner:
Abnormal volumes
Timeframe : 5 days
Abnormal volumes
Timeframe : 20 days
Abnormal volumes
Timeframe : 50 days
Technical
A technical analysis in Daily of this INFLARX N.V. chart shows a bullish trend. 71.43% of the signals given by moving averages are bullish. The overall trend is reinforced by the strong bullish signals from short-term moving averages. An assessment of moving averages reveals several bullish signals that could impact this trend:
Bullish trend reversal : Moving Average 50
Type : Bullish
Timeframe : Daily
Bullish trend reversal : Moving Average 100
Type : Bullish
Timeframe : Daily
Bullish trend reversal : adaptative moving average 100
Type : Bullish
Timeframe : Daily
Moving Average bullish crossovers : MA20 & MA50
Type : Bullish
Timeframe : Daily
Moving Average bullish crossovers : AMA50 & AMA100
Type : Bullish
Timeframe : Daily
In fact, 15 technical indicators on 18 studied are currently positioned bullish. But beware of excesses. The Central Indicators scanner currently detects this:
RSI indicator is overbought : over 80
Type : Neutral
Timeframe : Daily
CCI indicator is overbought : over 100
Type : Neutral
Timeframe : Daily
Pivot points : price is over resistance 2
Type : Neutral
Timeframe : Daily
Pivot points : price is over resistance 3
Type : Neutral
Timeframe : Weekly
Central Patterns, the scanner specializing in chart patterns, did not identify any signals.
The presence of these Japanese chandelier patterns detected by Central Candlesticks that could impact the current short-term trend were also noted:
White gravestone / inverted hammer
Type : Neutral
Timeframe : Daily
Upside gap
Type : Bullish
Timeframe : Daily
Long white line
Type : Bullish
Timeframe : Daily
| S3 | S2 | S1 | Price | R1 | R2 | |
|---|---|---|---|---|---|---|
| ProTrendLines | 2.72 | 3.24 | 4.56 | 5.95 | 6.34 | 8.96 |
| Change (%) | -54.29% | -45.55% | -23.36% | - | +6.55% | +50.59% |
| Change | -3.23 | -2.71 | -1.39 | - | +0.39 | +3.01 |
| Level | Intermediate | Intermediate | Minor | - | Intermediate | Major |
Pivot points can also be used to set your price objectives. Here is the price situation in relation to pivot points:
| Pivot points | S3 | S2 | S1 | PP | R1 | R2 | R3 |
|---|---|---|---|---|---|---|---|
| Standard | 0.59 | 1.29 | 2.53 | 3.23 | 4.47 | 5.17 | 6.41 |
| Camarilla | 3.24 | 3.41 | 3.59 | 3.77 | 3.95 | 4.13 | 4.30 |
| Woodie | 0.86 | 1.43 | 2.80 | 3.37 | 4.74 | 5.31 | 6.68 |
| Fibonacci | 1.29 | 2.03 | 2.49 | 3.23 | 3.97 | 4.43 | 5.17 |
| Pivot points | S3 | S2 | S1 | PP | R1 | R2 | R3 |
|---|---|---|---|---|---|---|---|
| Standard | 1.61 | 1.69 | 1.82 | 1.90 | 2.03 | 2.11 | 2.24 |
| Camarilla | 1.88 | 1.90 | 1.92 | 1.94 | 1.96 | 1.98 | 2.00 |
| Woodie | 1.63 | 1.70 | 1.84 | 1.91 | 2.05 | 2.12 | 2.26 |
| Fibonacci | 1.69 | 1.77 | 1.82 | 1.90 | 1.98 | 2.03 | 2.11 |
| Pivot points | S3 | S2 | S1 | PP | R1 | R2 | R3 |
|---|---|---|---|---|---|---|---|
| Standard | 1.23 | 1.40 | 1.67 | 1.84 | 2.11 | 2.28 | 2.55 |
| Camarilla | 1.82 | 1.86 | 1.90 | 1.94 | 1.98 | 2.02 | 2.06 |
| Woodie | 1.28 | 1.43 | 1.72 | 1.87 | 2.16 | 2.31 | 2.60 |
| Fibonacci | 1.40 | 1.57 | 1.67 | 1.84 | 2.01 | 2.11 | 2.28 |
Numerical data
The following are the details of the technical indicators and moving averages that were collected to generate this technical analysis:
| RSI (14): | 82.32 | |
| MACD (12,26,9): | 0.1200 | |
| Directional Movement: | 50.20 | |
| AROON (14): | 71.43 | |
| DEMA (21): | 2.18 | |
| Parabolic SAR (0,02-0,02-0,2): | 1.70 | |
| Elder Ray (13): | 0.80 | |
| Super Trend (3,10): | 2.00 | |
| Zig ZAG (10): | 3.77 | |
| VORTEX (21): | 0.9800 | |
| Stochastique (14,3,5): | 91.08 | |
| TEMA (21): | 2.38 | |
| Williams %R (14): | -6.78 | |
| Chande Momentum Oscillator (20): | 2.11 | |
| Repulse (5,40,3): | 61.5400 | |
| ROCnROLL: | 1 | |
| TRIX (15,9): | -0.2300 | |
| Courbe Coppock: | 48.69 |
| MA7: | 2.18 | |
| MA20: | 1.96 | |
| MA50: | 2.05 | |
| MA100: | 2.31 | |
| MAexp7: | 2.38 | |
| MAexp20: | 2.08 | |
| MAexp50: | 2.10 | |
| MAexp100: | 2.19 | |
| Price / MA7: | +172.94% | |
| Price / MA20: | +203.57% | |
| Price / MA50: | +190.24% | |
| Price / MA100: | +157.58% | |
| Price / MAexp7: | +150.00% | |
| Price / MAexp20: | +186.06% | |
| Price / MAexp50: | +183.33% | |
| Price / MAexp100: | +171.69% |
News
The latest news and videos published on INFLARX N.V. at the time of the analysis were as follows:
- InflaRx Receives FDA Emergency Use Authorization for Gohibic (vilobelimab) for Treatment of Critically Ill COVID-19 Patients
- InflaRx Reports Full Year 2022 Financial and Operating Results
- InflaRx Provides Update on Planned Phase III Study Design in Pyoderma Gangrenosum with Vilobelimab and Status of its EUA Application in Critically Ill COVID-19 Patients
- InflaRx Announces Amendment of Co-Development Agreement and Additional Equity Investment by Staidson in Connection with Regulatory Filing in China for Anti-C5a-Antibody for Treatment of COVID-19
- InflaRx Initiates First-in-Human Study with Small Molecule C5aR Inhibitor INF904
About author

Online


Add a comment
Comments
0 comments on the analysis INFLARX N.V. - Daily