PFIZER INC. - Daily - Technical analysis published on 01/10/2023 (GMT)
- 188
- 0
Click here for a new analysis!
- Timeframe : Daily
- - Analysis generated on
- Status : TARGET REACHED

Summary of the analysis

Additional analysis
Quotes
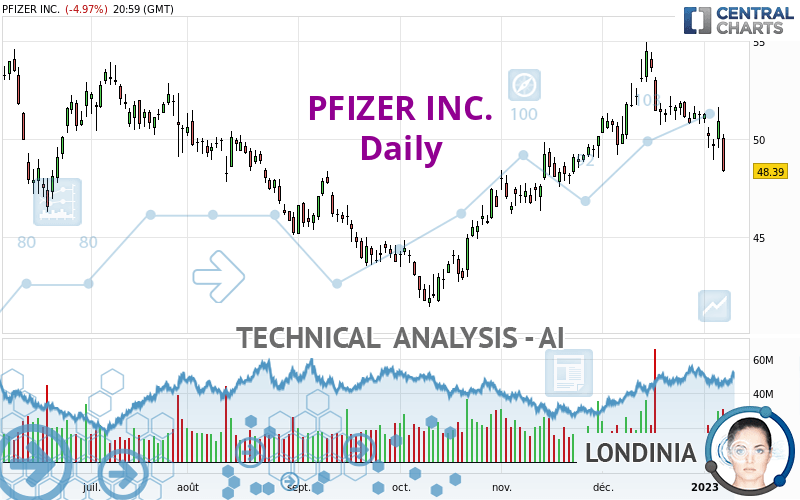
PFIZER INC. rating 48.39 USD. The price registered a decrease of -4.97% on the session and was traded between 48.31 USD and 50.26 USD over the period. The price is currently at +0.17% from its lowest and -3.72% from its highest.The Central Gaps scanner detects a bearish opening. A small advantage for sellers in the very short term.
Bearish opening
Type : Bearish
Timeframe : Openning
A study of price movements over other periods shows the following variations:
Near a new HIGH record (1st january)
Type : Bullish
Timeframe : Weekly
New LOW record (1st january)
Type : Bearish
Timeframe : Weekly
New LOW record (1 month)
Type : Bearish
Timeframe : Weekly
Technical
A technical analysis in Daily of this PFIZER INC. chart shows a slightly bearish trend. 60.71% of the signals given by moving averages are bearish. This slightly bearish trend could be reinforced by the strong bearish signals given by short-term moving averages. An assessment of moving averages reveals several bearish signals that could impact this trend:
Bearish price crossover with Moving Average 50
Type : Bearish
Timeframe : Daily
Bearish price crossover with adaptative moving average 50
Type : Bearish
Timeframe : Daily
Bearish price crossover with adaptative moving average 100
Type : Bearish
Timeframe : Daily
The technical indicators are generally neutral. They do not provide relevant information on the direction of future price movements.
Caution: the Central Indicators scanner currently detects an excess:
CCI indicator is oversold : under -100
Type : Neutral
Timeframe : Daily
Williams %R indicator is oversold : under -80
Type : Neutral
Timeframe : Daily
Pivot points : price is under support 1
Type : Neutral
Timeframe : Weekly
Pivot points : price is under support 3
Type : Neutral
Timeframe : Daily
RSI indicator is back under 50
Type : Bearish
Timeframe : Daily
The Central Patterns scanner, which studies chart patterns, resistances and supports, has identified this signal:
Near support of channel
Type : Bullish
Timeframe : Daily
The Central Candlesticks scanner, specialised in Japanese candlesticks, did not identify any signals.
| S3 | S2 | S1 | Price | R1 | R2 | R3 | |
|---|---|---|---|---|---|---|---|
| ProTrendLines | 41.40 | 44.65 | 45.78 | 48.39 | 48.41 | 49.70 | 51.44 |
| Change (%) | -14.45% | -7.73% | -5.39% | - | +0.04% | +2.71% | +6.30% |
| Change | -6.99 | -3.74 | -2.61 | - | +0.02 | +1.31 | +3.05 |
| Level | Minor | Minor | Intermediate | - | Intermediate | Intermediate | Minor |
To determine price objectives, it is also possible to use the pivot points. Here is the price position in relation to pivot points:
| Pivot points | S3 | S2 | S1 | PP | R1 | R2 | R3 |
|---|---|---|---|---|---|---|---|
| Standard | 45.76 | 47.04 | 47.71 | 48.99 | 49.66 | 50.94 | 51.61 |
| Camarilla | 47.85 | 48.03 | 48.21 | 48.39 | 48.57 | 48.75 | 48.93 |
| Woodie | 45.47 | 46.89 | 47.42 | 48.84 | 49.37 | 50.79 | 51.32 |
| Fibonacci | 47.04 | 47.78 | 48.24 | 48.99 | 49.73 | 50.19 | 50.94 |
| Pivot points | S3 | S2 | S1 | PP | R1 | R2 | R3 |
|---|---|---|---|---|---|---|---|
| Standard | 42.89 | 46.03 | 48.64 | 51.78 | 54.39 | 57.53 | 60.14 |
| Camarilla | 49.66 | 50.19 | 50.71 | 51.24 | 51.77 | 52.29 | 52.82 |
| Woodie | 42.62 | 45.90 | 48.37 | 51.65 | 54.12 | 57.40 | 59.87 |
| Fibonacci | 46.03 | 48.23 | 49.59 | 51.78 | 53.98 | 55.34 | 57.53 |
Numerical data
The following are the details of the technical indicators and moving averages that were collected to generate this technical analysis:
| RSI (14): | 38.59 | |
| MACD (12,26,9): | 0.0000 | |
| Directional Movement: | -4.35 | |
| AROON (14): | -100.00 | |
| DEMA (21): | 50.97 | |
| Parabolic SAR (0,02-0,02-0,2): | 52.56 | |
| Elder Ray (13): | -1.33 | |
| Super Trend (3,10): | 52.60 | |
| Zig ZAG (10): | 48.39 | |
| VORTEX (21): | 0.8700 | |
| Stochastique (14,3,5): | 20.97 | |
| TEMA (21): | 50.12 | |
| Williams %R (14): | -97.92 | |
| Chande Momentum Oscillator (20): | -2.93 | |
| Repulse (5,40,3): | -3.0100 | |
| ROCnROLL: | 2 | |
| TRIX (15,9): | 0.1400 | |
| Courbe Coppock: | 7.52 |
| MA7: | 50.42 | |
| MA20: | 51.46 | |
| MA50: | 49.66 | |
| MA100: | 47.27 | |
| MAexp7: | 50.16 | |
| MAexp20: | 50.69 | |
| MAexp50: | 49.67 | |
| MAexp100: | 48.80 | |
| Price / MA7: | -4.03% | |
| Price / MA20: | -5.97% | |
| Price / MA50: | -2.56% | |
| Price / MA100: | +2.37% | |
| Price / MAexp7: | -3.53% | |
| Price / MAexp20: | -4.54% | |
| Price / MAexp50: | -2.58% | |
| Price / MAexp100: | -0.84% |
News
The latest news and videos published on PFIZER INC. at the time of the analysis were as follows:
- U.S. FDA Accepts for Priority Review the Supplemental Biologics License Application for Pfizer’s 20-Valent Pneumococcal Conjugate Vaccine in Infants and Children
- Pfizer Invites Public to Listen to Webcast of Pfizer Discussion at Healthcare Conference
- Pfizer Announces Positive Top-Line Results from Phase 3 Study of Hemophilia B Gene Therapy Candidate
- U.S. FDA Accepts for Review the Biologics License Application for Pfizer’s Investigational Pentavalent Meningococcal Vaccine Candidate (MenABCWY) in Adolescents
- Pfizer Announces FDA and EMA Acceptance of Etrasimod Regulatory Submissions for Ulcerative Colitis
About author

Online


Add a comment
Comments
0 comments on the analysis PFIZER INC. - Daily