RANDSTAD NV - 1H - Technical analysis published on 10/10/2023 (GMT)
- 117
- 0
Click here for a new analysis!
- Timeframe : 1H
- - Analysis generated on
- Status : INVALID
Summary of the analysis

Additional analysis
Quotes
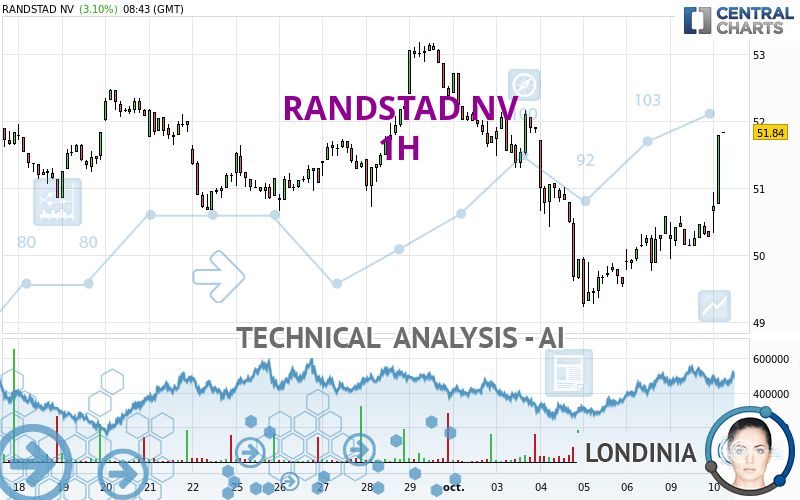
RANDSTAD NV rating 51.44 EUR. On the day, this instrument gained +2.31% with the lowest point at 50.34 EUR and the highest point at 51.62 EUR. The deviation from the price is +2.19% for the low point and -0.35% for the high point.The Central Gaps scanner detects a bullish gap which is a sign that buyers have taken the lead in the very short term.
Opening Gap UP
Type : Bullish
Timeframe : Openning
A study of price movements over other periods shows the following variations:
Near a new HIGH record (1 month)
Type : Bullish
Timeframe : Weekly
Technical
A technical analysis in 1H of this RANDSTAD NV chart shows a slightly bullish trend. Only 53.57% of the signals given by moving averages are bullish. This slightly bullish trend is reinforced by the strong signals currently being given by short-term moving averages. An assessment of moving averages reveals several bullish signals that could impact this trend:
Bullish trend reversal : adaptative moving average 50
Type : Bullish
Timeframe : 1 hour
Bullish price crossover with Moving Average 100
Type : Bullish
Timeframe : 1 hour
Bullish price crossover with adaptative moving average 50
Type : Bullish
Timeframe : 1 hour
Bullish price crossover with adaptative moving average 100
Type : Bullish
Timeframe : 1 hour
The probability of a further increase is high given the direction of the technical indicators.
But beware of excesses. The Central Indicators scanner currently detects this:
CCI indicator is overbought : over 100
Type : Neutral
Timeframe : 1 hour
Williams %R indicator is overbought : over -20
Type : Neutral
Timeframe : 1 hour
Pivot points : price is over resistance 3
Type : Neutral
Timeframe : 1 hour
Ichimoku : price is over the cloud
Type : Bullish
Timeframe : 1 hour
Price is back over the pivot point
Type : Bullish
Timeframe : Weekly
Central Patterns, the market scanner focusing on chart patterns, resistances and supports found these results:
Near horizontal resistance
Type : Bearish
Timeframe : 1 hour
Resistance of channel is broken
Type : Bullish
Timeframe : 1 hour
No result was found by the Central Candlesticks scanner on Japanese candlesticks.
| S3 | S2 | S1 | Price | R1 | R2 | R3 | |
|---|---|---|---|---|---|---|---|
| ProTrendLines | 49.76 | 50.14 | 50.86 | 51.44 | 51.64 | 52.48 | 53.18 |
| Change (%) | -3.27% | -2.53% | -1.13% | - | +0.39% | +2.02% | +3.38% |
| Change | -1.68 | -1.30 | -0.58 | - | +0.20 | +1.04 | +1.74 |
| Level | Minor | Minor | Major | - | Minor | Intermediate | Minor |
Pivot points can also be used to set your price objectives. Here is the price situation in relation to pivot points:
| Pivot points | S3 | S2 | S1 | PP | R1 | R2 | R3 |
|---|---|---|---|---|---|---|---|
| Standard | 49.33 | 49.64 | 49.96 | 50.27 | 50.59 | 50.90 | 51.22 |
| Camarilla | 50.11 | 50.17 | 50.22 | 50.28 | 50.34 | 50.40 | 50.45 |
| Woodie | 49.34 | 49.64 | 49.97 | 50.27 | 50.60 | 50.90 | 51.23 |
| Fibonacci | 49.64 | 49.88 | 50.03 | 50.27 | 50.51 | 50.66 | 50.90 |
| Pivot points | S3 | S2 | S1 | PP | R1 | R2 | R3 |
|---|---|---|---|---|---|---|---|
| Standard | 45.48 | 47.35 | 48.97 | 50.84 | 52.46 | 54.33 | 55.95 |
| Camarilla | 49.62 | 49.94 | 50.26 | 50.58 | 50.90 | 51.22 | 51.54 |
| Woodie | 45.35 | 47.29 | 48.84 | 50.78 | 52.33 | 54.27 | 55.82 |
| Fibonacci | 47.35 | 48.69 | 49.51 | 50.84 | 52.18 | 53.00 | 54.33 |
| Pivot points | S3 | S2 | S1 | PP | R1 | R2 | R3 |
|---|---|---|---|---|---|---|---|
| Standard | 46.31 | 48.49 | 50.43 | 52.61 | 54.55 | 56.73 | 58.67 |
| Camarilla | 51.25 | 51.63 | 52.00 | 52.38 | 52.76 | 53.14 | 53.51 |
| Woodie | 46.20 | 48.43 | 50.32 | 52.55 | 54.44 | 56.67 | 58.56 |
| Fibonacci | 48.49 | 50.06 | 51.03 | 52.61 | 54.18 | 55.15 | 56.73 |
Numerical data
The following is the status of the technical indicators and moving averages at the time of publication of this technical analysis:
| RSI (14): | 67.97 | |
| MACD (12,26,9): | 0.1000 | |
| Directional Movement: | 23.19 | |
| AROON (14): | 100.00 | |
| DEMA (21): | 50.47 | |
| Parabolic SAR (0,02-0,02-0,2): | 50.28 | |
| Elder Ray (13): | 0.69 | |
| Super Trend (3,10): | 50.13 | |
| Zig ZAG (10): | 51.52 | |
| VORTEX (21): | 1.1200 | |
| Stochastique (14,3,5): | 80.24 | |
| TEMA (21): | 50.78 | |
| Williams %R (14): | -4.60 | |
| Chande Momentum Oscillator (20): | 1.24 | |
| Repulse (5,40,3): | 2.0500 | |
| ROCnROLL: | 1 | |
| TRIX (15,9): | -0.0100 | |
| Courbe Coppock: | 2.01 |
| MA7: | 50.79 | |
| MA20: | 51.33 | |
| MA50: | 52.54 | |
| MA100: | 50.85 | |
| MAexp7: | 50.67 | |
| MAexp20: | 50.42 | |
| MAexp50: | 50.62 | |
| MAexp100: | 51.01 | |
| Price / MA7: | +1.28% | |
| Price / MA20: | +0.21% | |
| Price / MA50: | -2.09% | |
| Price / MA100: | +1.16% | |
| Price / MAexp7: | +1.52% | |
| Price / MAexp20: | +2.02% | |
| Price / MAexp50: | +1.62% | |
| Price / MAexp100: | +0.84% |
News
The last news published on RANDSTAD NV at the time of the generation of this analysis was as follows:
- Randstad acquires Cella, Inc.
- Randstad US's TRANSCEND Program Announces First National Private-Nonprofit Partnership Focused on Skilling with Cisco, TechBridge and Urban Strategies
- Randstad's workmonitor 2021 first edition finds more job optimism and role for business in vaccination rollout
- JetBlue partners with Randstad RiseSmart to provide crewmembers with outplacement support
- Randstad RiseSmart accelerates expansion in Europe with acquisition of German outplacement firm
About author
Online


Add a comment
Comments
0 comments on the analysis RANDSTAD NV - 1H