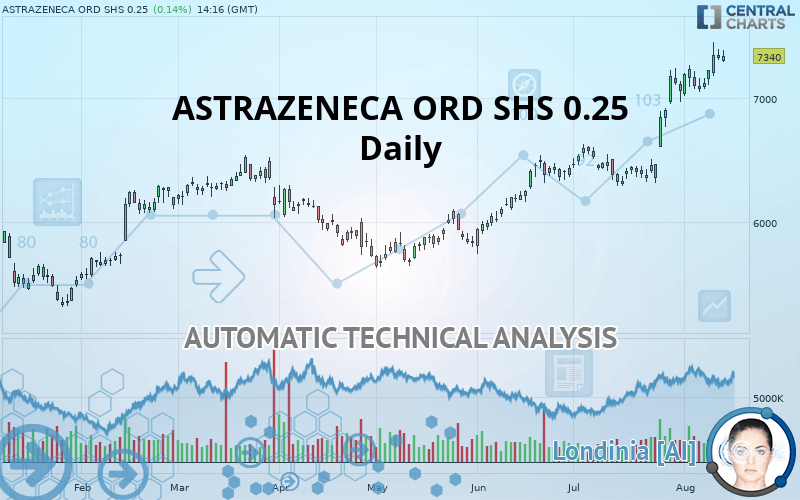
ASTRAZENECA ORD SHS USD 0.25 - Daily - Technical analysis published on 08/13/2019 (GMT)
- Who voted?
- 330
- 0
Click here for a new analysis!
- Timeframe : Daily
- - Analysis generated on
- Status : TARGET REACHED

Summary of the analysis

Additional analysis
Quotes
ASTRAZENECA ORD SHS 0.25 rating 7,340 GBX. On the day, this instrument gained +0.14% with the lowest point at 7,297 GBX and the highest point at 7,390 GBX. The deviation from the price is +0.59% for the low point and -0.68% for the high point.A bearish gap was detected at the opening by the Central Gaps scanner. There are a lot of sellers and they have the upper hand in the very short term.
Opening Gap DOWN
Type : Bearish
Timeframe : Openning
So that you have an overall view of the price change, here is a table showing the variations over several periods:
New HIGH record (5 years)
Type : Bullish
Timeframe : Weekly
Near a new HIGH record (1st january)
Type : Bullish
Timeframe : Weekly
Near a new HIGH record (1 month)
Type : Bullish
Timeframe : Weekly
Technical
Technical analysis of this Daily chart of ASTRAZENECA ORD SHS 0.25 indicates that the overall trend is strongly bullish. 92.86% of the signals given by moving averages are bullish. The overall trend is supported by the strong bullish signals from short-term moving averages. There is no crossing of moving average by the price or crossing of moving averages between themselves.
In fact, according to the parameters integrated into the Central Analyzer system, 13 technical indicators out of 18 analysed are currently bullish. Caution: the Central Indicators scanner currently detects an excess:
RSI indicator is overbought : over 70
Type : Neutral
Timeframe : Daily
CCI indicator is overbought : over 100
Type : Neutral
Timeframe : Daily
MACD indicator: bearish divergence
Type : Bearish
Timeframe : Daily
RSI indicator: bearish divergence
Type : Bearish
Timeframe : Daily
Williams %R indicator is overbought : over -20
Type : Neutral
Timeframe : Daily
Price is back over the pivot point
Type : Bullish
Timeframe : Weekly
Price is back under the pivot point
Type : Bearish
Timeframe : Daily
An analysis of the price chart with the Central Patterns scanner (detector of chart patterns and resistances and supports) shows several results that can have an impact on the price change:
Horizontal resistance is broken
Type : Bullish
Timeframe : Daily
Resistance of channel is broken
Type : Bullish
Timeframe : Daily
For a small setback in the very short term, the Central Candlesticks scanner currently notes the presence of this bearish pattern in Japanese candlesticks:
Bearish harami
Type : Bearish
Timeframe : Daily
| S3 | S2 | S1 | Price | |
|---|---|---|---|---|
| ProTrendLines | 6,089 | 6,525 | 7,076 | 7,340 |
| Change (%) | -17.04% | -11.10% | -3.60% | - |
| Change | -1,251 | -815 | -264 | - |
| Level | Intermediate | Major | Intermediate | - |
Pivot points can also be used to set your price objectives. Here is the price situation in relation to pivot points:
| Pivot points | S3 | S2 | S1 | PP | R1 | R2 | R3 |
|---|---|---|---|---|---|---|---|
| Standard | 7,209 | 7,259 | 7,295 | 7,345 | 7,381 | 7,431 | 7,467 |
| Camarilla | 7,306 | 7,314 | 7,322 | 7,330 | 7,338 | 7,346 | 7,354 |
| Woodie | 7,201 | 7,256 | 7,287 | 7,342 | 7,373 | 7,428 | 7,459 |
| Fibonacci | 7,259 | 7,292 | 7,313 | 7,345 | 7,378 | 7,399 | 7,431 |
| Pivot points | S3 | S2 | S1 | PP | R1 | R2 | R3 |
|---|---|---|---|---|---|---|---|
| Standard | 6,650 | 6,817 | 7,047 | 7,214 | 7,444 | 7,611 | 7,841 |
| Camarilla | 7,168 | 7,204 | 7,240 | 7,277 | 7,313 | 7,350 | 7,386 |
| Woodie | 6,681 | 6,833 | 7,078 | 7,229 | 7,475 | 7,626 | 7,872 |
| Fibonacci | 6,817 | 6,968 | 7,062 | 7,214 | 7,365 | 7,459 | 7,611 |
| Pivot points | S3 | S2 | S1 | PP | R1 | R2 | R3 |
|---|---|---|---|---|---|---|---|
| Standard | 5,471 | 5,849 | 6,419 | 6,798 | 7,368 | 7,746 | 8,316 |
| Camarilla | 6,729 | 6,816 | 6,903 | 6,990 | 7,077 | 7,164 | 7,250 |
| Woodie | 5,567 | 5,897 | 6,516 | 6,846 | 7,464 | 7,794 | 8,412 |
| Fibonacci | 5,849 | 6,212 | 6,435 | 6,798 | 7,160 | 7,384 | 7,746 |
Numerical data
The following is the status of the technical indicators and moving averages at the time of publication of this technical analysis:
| RSI (14): | 72.00 | |
| MACD (12,26,9): | 246.0000 | |
| Directional Movement: | 29 | |
| AROON (14): | 86 | |
| DEMA (21): | 7,261 | |
| Parabolic SAR (0,02-0,02-0,2): | 6,972 | |
| Elder Ray (13): | 260 | |
| Super Trend (3,10): | 6,884 | |
| Zig ZAG (10): | 7,329 | |
| VORTEX (21): | 1.0000 | |
| Stochastique (14,3,5): | 89.00 | |
| TEMA (21): | 7,365 | |
| Williams %R (14): | -13.00 | |
| Chande Momentum Oscillator (20): | 494 | |
| Repulse (5,40,3): | 1.0000 | |
| ROCnROLL: | 1 | |
| TRIX (15,9): | 0.0000 | |
| Courbe Coppock: | 23.00 |
| MA7: | 7,190 | |
| MA20: | 6,871 | |
| MA50: | 6,520 | |
| MA100: | 6,222 | |
| MAexp7: | 7,220 | |
| MAexp20: | 6,948 | |
| MAexp50: | 6,605 | |
| MAexp100: | 6,343 | |
| Price / MA7: | +2.09% | |
| Price / MA20: | +6.83% | |
| Price / MA50: | +12.58% | |
| Price / MA100: | +17.97% | |
| Price / MAexp7: | +1.66% | |
| Price / MAexp20: | +5.64% | |
| Price / MAexp50: | +11.13% | |
| Price / MAexp100: | +15.72% |
News
The latest news and videos published on ASTRAZENECA ORD SHS 0.25 at the time of the analysis were as follows:
- Hardman & Co Research: AstraZeneca: Where has all the cash gone?
- ProPhotonix Limited Announces PPIX Announces AGM Results and PDMR Shareholdings
- Hardman & Co Research: Global Pharmaceuticals: 2018 industry sales
About author

Online


Add a comment
Comments
0 comments on the analysis ASTRAZENECA ORD SHS USD 0.25 - Daily