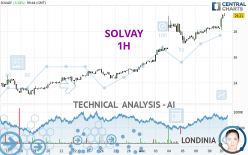
SOLVAY - 1H - Technical analysis published on 04/10/2024 (GMT)
- 72
- 0
Click here for a new analysis!
- Timeframe : 1H
- - Analysis generated on
- Status : INVALID
Summary of the analysis

Additional analysis
Quotes
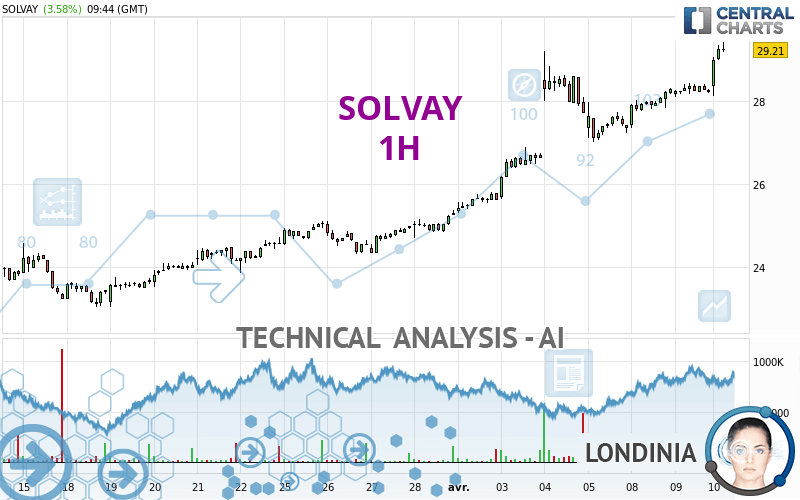
The SOLVAY rating is 29.34 EUR. The price has increased by +4.04% since the last closing with the lowest point at 28.12 EUR and the highest point at 29.36 EUR. The deviation from the price is +4.34% for the low point and -0.07% for the high point.Here is a more detailed summary of the historical variations registered by SOLVAY:
New HIGH record (5 years)
Type : Bullish
Timeframe : Weekly
New HIGH record (1 year)
Type : Bullish
Timeframe : Weekly
New HIGH record (1st january)
Type : Bullish
Timeframe : Weekly
New HIGH record (1 month)
Type : Bullish
Timeframe : Weekly
Technical
Technical analysis of this 1H chart of SOLVAY indicates that the overall trend is strongly bullish. 92.86% of the signals given by moving averages are bullish. The overall trend is supported by the strong bullish signals from short-term moving averages. The Central Indicators market scanner currently does not detect any result that concerns moving averages.
In fact, 16 technical indicators on 18 studied are currently bullish. Caution: the Central Indicators scanner currently detects an excess:
RSI indicator is overbought : over 70
Type : Neutral
Timeframe : 1 hour
CCI indicator is overbought : over 100
Type : Neutral
Timeframe : 1 hour
Previous candle closed over Bollinger bands
Type : Neutral
Timeframe : 1 hour
Williams %R indicator is overbought : over -20
Type : Neutral
Timeframe : 1 hour
Pivot points : price is over resistance 1
Type : Neutral
Timeframe : Weekly
Pivot points : price is over resistance 3
Type : Neutral
Timeframe : 1 hour
An analysis of the price chart with the Central Patterns scanner (detector of chart patterns and resistances and supports) shows several results that can have an impact on the price change:
Near horizontal resistance
Type : Bearish
Timeframe : 1 hour
Resistance of channel is broken
Type : Bullish
Timeframe : 1 hour
The Central Candlesticks scanner which studies Japanese candlesticks did not detect anything.
| S3 | S2 | S1 | Price | |
|---|---|---|---|---|
| ProTrendLines | 27.31 | 28.43 | 29.19 | 29.34 |
| Change (%) | -6.92% | -3.10% | -0.51% | - |
| Change | -2.03 | -0.91 | -0.15 | - |
| Level | Minor | Minor | Major | - |
Attention could also be paid to pivot points to set price objectives:
| Pivot points | S3 | S2 | S1 | PP | R1 | R2 | R3 |
|---|---|---|---|---|---|---|---|
| Standard | 27.64 | 27.85 | 28.02 | 28.23 | 28.40 | 28.61 | 28.78 |
| Camarilla | 28.10 | 28.13 | 28.17 | 28.20 | 28.24 | 28.27 | 28.31 |
| Woodie | 27.63 | 27.84 | 28.01 | 28.22 | 28.39 | 28.60 | 28.77 |
| Fibonacci | 27.85 | 27.99 | 28.08 | 28.23 | 28.37 | 28.46 | 28.61 |
| Pivot points | S3 | S2 | S1 | PP | R1 | R2 | R3 |
|---|---|---|---|---|---|---|---|
| Standard | 21.48 | 23.39 | 25.37 | 27.28 | 29.26 | 31.17 | 33.15 |
| Camarilla | 26.28 | 26.64 | 26.99 | 27.35 | 27.71 | 28.06 | 28.42 |
| Woodie | 21.52 | 23.41 | 25.41 | 27.30 | 29.30 | 31.19 | 33.19 |
| Fibonacci | 23.39 | 24.88 | 25.79 | 27.28 | 28.77 | 29.68 | 31.17 |
| Pivot points | S3 | S2 | S1 | PP | R1 | R2 | R3 |
|---|---|---|---|---|---|---|---|
| Standard | 20.47 | 21.72 | 23.51 | 24.76 | 26.55 | 27.80 | 29.59 |
| Camarilla | 24.46 | 24.74 | 25.02 | 25.30 | 25.58 | 25.86 | 26.14 |
| Woodie | 20.74 | 21.86 | 23.78 | 24.90 | 26.82 | 27.94 | 29.86 |
| Fibonacci | 21.72 | 22.88 | 23.60 | 24.76 | 25.92 | 26.64 | 27.80 |
Numerical data
The following are the details of the technical indicators and moving averages that were collected to generate this technical analysis:
| RSI (14): | 75.49 | |
| MACD (12,26,9): | 0.3800 | |
| Directional Movement: | 31.99 | |
| AROON (14): | 92.86 | |
| DEMA (21): | 28.84 | |
| Parabolic SAR (0,02-0,02-0,2): | 28.12 | |
| Elder Ray (13): | 0.75 | |
| Super Trend (3,10): | 28.47 | |
| Zig ZAG (10): | 29.31 | |
| VORTEX (21): | 1.3800 | |
| Stochastique (14,3,5): | 94.35 | |
| TEMA (21): | 28.89 | |
| Williams %R (14): | -3.23 | |
| Chande Momentum Oscillator (20): | 1.04 | |
| Repulse (5,40,3): | 2.1800 | |
| ROCnROLL: | 1 | |
| TRIX (15,9): | 0.1500 | |
| Courbe Coppock: | 5.27 |
| MA7: | 27.59 | |
| MA20: | 25.49 | |
| MA50: | 24.45 | |
| MA100: | 24.77 | |
| MAexp7: | 28.80 | |
| MAexp20: | 28.35 | |
| MAexp50: | 27.61 | |
| MAexp100: | 26.66 | |
| Price / MA7: | +6.34% | |
| Price / MA20: | +15.10% | |
| Price / MA50: | +20.00% | |
| Price / MA100: | +18.45% | |
| Price / MAexp7: | +1.88% | |
| Price / MAexp20: | +3.49% | |
| Price / MAexp50: | +6.27% | |
| Price / MAexp100: | +10.05% |
News
Don't forget to follow the news on SOLVAY. At the time of publication of this analysis, the latest news was as follows:
- Solvay fourth quarter and full-year 2023 results
- Syensqo is born following overwhelming support of shareholders on demerger of Solvay
- Shareholders overwhelmingly support the creation of two independent companies - Solvay and Syensqo
- Solvay announces the publication of a supplement to its information document
- Syensqo launches its 5-year growth strategy to create significant value
About author
Online


Add a comment
Comments
0 comments on the analysis SOLVAY - 1H