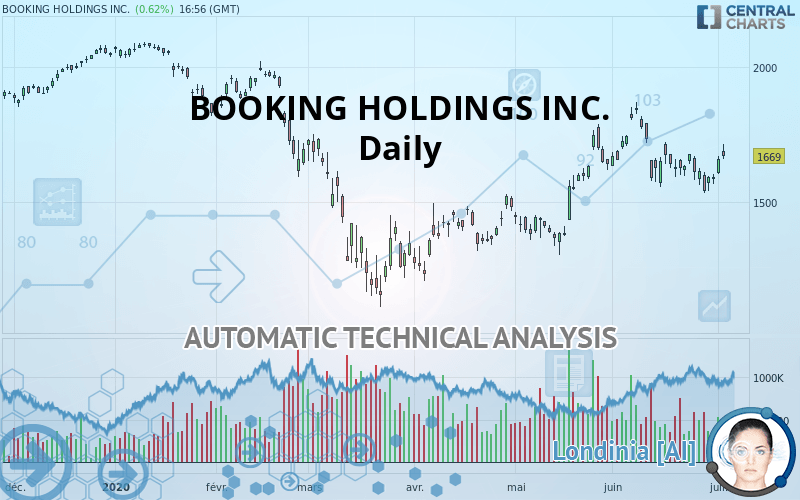
BOOKING HOLDINGS INC. - Daily - Technical analysis published on 07/04/2020 (GMT)
- Who voted?
- 417
- 0
Click here for a new analysis!
- Timeframe : Daily
- - Analysis generated on
- Status : TARGET REACHED
Summary of the analysis

Additional analysis
Quotes
The BOOKING HOLDINGS INC. rating is 1,669.00 USD. The price registered an increase of +0.62% on the session and was between 1,658.40 USD and 1,714.09 USD. This implies that the price is at +0.64% from its lowest and at -2.63% from its highest.The Central Gaps scanner detects the formation of a bullish gap marking the strong presence of buyers against sellers at the opening. This formed a quotation gap.
Opening Gap UP
Type : Bullish
Timeframe : Openning
Here is a more detailed summary of the historical variations registered by BOOKING HOLDINGS INC.:
Technical
Technical analysis of this Daily chart of BOOKING HOLDINGS INC. indicates that the overall trend is bullish. 75.00% of the signals given by moving averages are bullish. The overall trend seems to be showing some signs of weakness, as do the tentative bullish signals given by short-term moving averages. The Central Indicators scanner detects bullish signals on moving averages that could impact this trend:
Bullish trend reversal : adaptative moving average 20
Type : Bullish
Timeframe : Daily
Bullish trend reversal : adaptative moving average 50
Type : Bullish
Timeframe : Daily
Bullish trend reversal : adaptative moving average 100
Type : Bullish
Timeframe : Daily
Bullish price crossover with adaptative moving average 20
Type : Bullish
Timeframe : Daily
In fact, 11 technical indicators on 18 studied are currently positioned bullish. Central Indicators, the scanner specialised in technical indicators, has identified these signals:
Pivot points : price is over resistance 1
Type : Neutral
Timeframe : Weekly
RSI indicator is back over 50
Type : Bullish
Timeframe : Daily
Parabolic SAR indicator bullish reversal
Type : Bullish
Timeframe : Daily
MACD indicator is back over 0
Type : Bullish
Timeframe : Daily
Price is back over the pivot point
Type : Bullish
Timeframe : Daily
Price is back under the pivot point
Type : Bearish
Timeframe : Weekly
Momentum indicator is back over 0
Type : Bullish
Timeframe : Daily
Williams %R indicator is back over -50
Type : Bullish
Timeframe : Daily
Central Patterns, the scanner specializing in chart patterns, did not identify any signals.
The Central Candlesticks scanner which studies Japanese candlesticks did not detect anything.
| S3 | S2 | S1 | Price | R1 | R2 | R3 | |
|---|---|---|---|---|---|---|---|
| ProTrendLines | 1,366.07 | 1,468.37 | 1,616.83 | 1,669.00 | 1,789.70 | 1,938.74 | 2,083.75 |
| Change (%) | -18.15% | -12.02% | -3.13% | - | +7.23% | +16.16% | +24.85% |
| Change | -302.93 | -200.63 | -52.17 | - | +120.70 | +269.74 | +414.75 |
| Level | Minor | Minor | Major | - | Major | Intermediate | Major |
To determine price objectives, it is also possible to use the pivot points. Here is the price position in relation to pivot points:
| Pivot points | S3 | S2 | S1 | PP | R1 | R2 | R3 |
|---|---|---|---|---|---|---|---|
| Standard | 1,547.76 | 1,574.45 | 1,616.62 | 1,643.31 | 1,685.48 | 1,712.17 | 1,754.34 |
| Camarilla | 1,639.85 | 1,646.17 | 1,652.48 | 1,658.79 | 1,665.10 | 1,671.41 | 1,677.73 |
| Woodie | 1,555.50 | 1,578.32 | 1,624.36 | 1,647.18 | 1,693.22 | 1,716.04 | 1,762.08 |
| Fibonacci | 1,574.45 | 1,600.75 | 1,617.01 | 1,643.31 | 1,669.61 | 1,685.87 | 1,712.17 |
| Pivot points | S3 | S2 | S1 | PP | R1 | R2 | R3 |
|---|---|---|---|---|---|---|---|
| Standard | 1,344.22 | 1,438.52 | 1,489.89 | 1,584.19 | 1,635.56 | 1,729.86 | 1,781.23 |
| Camarilla | 1,501.19 | 1,514.54 | 1,527.90 | 1,541.25 | 1,554.60 | 1,567.96 | 1,581.31 |
| Woodie | 1,322.75 | 1,427.79 | 1,468.42 | 1,573.46 | 1,614.09 | 1,719.13 | 1,759.76 |
| Fibonacci | 1,438.52 | 1,494.17 | 1,528.55 | 1,584.19 | 1,639.84 | 1,674.22 | 1,729.86 |
| Pivot points | S3 | S2 | S1 | PP | R1 | R2 | R3 |
|---|---|---|---|---|---|---|---|
| Standard | 1,120.32 | 1,326.57 | 1,459.46 | 1,665.71 | 1,798.60 | 2,004.85 | 2,137.74 |
| Camarilla | 1,499.08 | 1,530.16 | 1,561.25 | 1,592.34 | 1,623.43 | 1,654.52 | 1,685.60 |
| Woodie | 1,083.63 | 1,308.23 | 1,422.77 | 1,647.37 | 1,761.91 | 1,986.51 | 2,101.05 |
| Fibonacci | 1,326.57 | 1,456.13 | 1,536.16 | 1,665.71 | 1,795.27 | 1,875.30 | 2,004.85 |
Numerical data
The following are the details of the technical indicators and moving averages that were collected to generate this technical analysis:
| RSI (14): | 54.51 | |
| MACD (12,26,9): | 5.9300 | |
| Directional Movement: | 5.49 | |
| AROON (14): | -57.14 | |
| DEMA (21): | 1,647.62 | |
| Parabolic SAR (0,02-0,02-0,2): | 1,535.57 | |
| Elder Ray (13): | 53.69 | |
| Super Trend (3,10): | 1,780.41 | |
| Zig ZAG (10): | 1,669.00 | |
| VORTEX (21): | 0.9300 | |
| Stochastique (14,3,5): | 56.72 | |
| TEMA (21): | 1,620.41 | |
| Williams %R (14): | -27.96 | |
| Chande Momentum Oscillator (20): | -4.74 | |
| Repulse (5,40,3): | 1.0800 | |
| ROCnROLL: | 1 | |
| TRIX (15,9): | 0.1300 | |
| Courbe Coppock: | 7.99 |
| MA7: | 1,611.47 | |
| MA20: | 1,659.30 | |
| MA50: | 1,573.01 | |
| MA100: | 1,544.26 | |
| MAexp7: | 1,630.38 | |
| MAexp20: | 1,632.17 | |
| MAexp50: | 1,598.91 | |
| MAexp100: | 1,615.68 | |
| Price / MA7: | +3.57% | |
| Price / MA20: | +0.58% | |
| Price / MA50: | +6.10% | |
| Price / MA100: | +8.08% | |
| Price / MAexp7: | +2.37% | |
| Price / MAexp20: | +2.26% | |
| Price / MAexp50: | +4.38% | |
| Price / MAexp100: | +3.30% |
About author

Online


Add a comment
Comments
0 comments on the analysis BOOKING HOLDINGS INC. - Daily