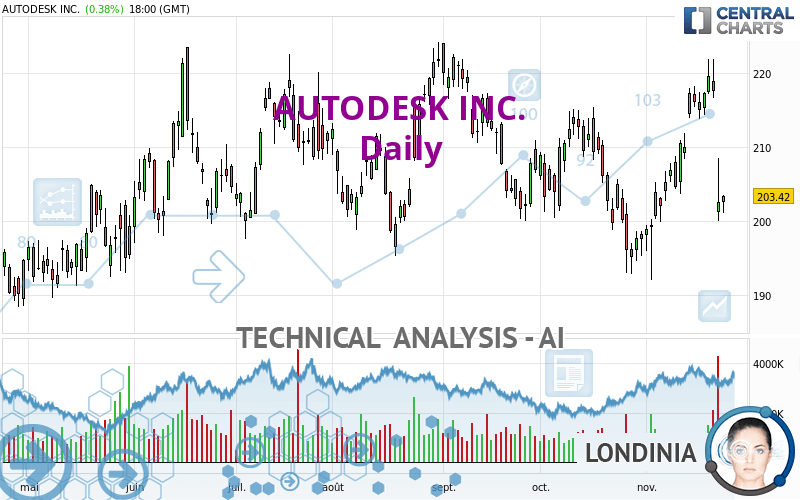
AUTODESK INC. - Daily - Technical analysis published on 11/25/2023 (GMT)
- 112
- 0
Click here for a new analysis!
- Timeframe : Daily
- - Analysis generated on
- Status : INVALID

Summary of the analysis

Additional analysis
Quotes
The AUTODESK INC. price is 203.42 USD. The price registered an increase of +0.38% on the session with the lowest point at 201.11 USD and the highest point at 203.57 USD. The deviation from the price is +1.15% for the low point and -0.07% for the high point.A study of price movements over other periods shows the following variations:
Near a new LOW record (1 month)
Type : Bearish
Timeframe : Weekly
Technical
Technical analysis of this Daily chart of AUTODESK INC. indicates that the overall trend is bearish. 78.57% of the signals given by moving averages are bearish. This bearish trend is slowing down slightly given the slightly bearish signals given by short-term moving averages. An assessment of moving averages reveals several bearish signals that could impact this trend:
Bearish trend reversal : Moving Average 50
Type : Bearish
Timeframe : Daily
Bearish trend reversal : Moving Average 100
Type : Bearish
Timeframe : Daily
Bearish trend reversal : adaptative moving average 20
Type : Bearish
Timeframe : Daily
Bearish trend reversal : adaptative moving average 50
Type : Bearish
Timeframe : Daily
Bearish trend reversal : adaptative moving average 100
Type : Bearish
Timeframe : Daily
In fact, of the 18 technical indicators analysed by Central Analyzer, 4 are bullish, 6 are neutral and 8 are bearish. Caution: the Central Indicators scanner currently detects an excess:
RSI indicator: bullish divergence
Type : Bullish
Timeframe : Daily
Williams %R indicator is oversold : under -80
Type : Neutral
Timeframe : Daily
Pivot points : price is under support 3
Type : Neutral
Timeframe : Weekly
MACD crosses DOWN its Moving Average
Type : Bearish
Timeframe : Daily
Momentum indicator is back under 0
Type : Bearish
Timeframe : Daily
Central Patterns, the market scanner focusing on chart patterns, resistances and supports found this result:
Near support of channel
Type : Bullish
Timeframe : Daily
The Central Candlesticks scanner which studies Japanese candlesticks did not detect anything.
| S3 | S2 | S1 | Price | R1 | R2 | R3 | |
|---|---|---|---|---|---|---|---|
| ProTrendLines | 189.90 | 195.13 | 198.70 | 203.42 | 208.25 | 213.99 | 221.40 |
| Change (%) | -6.65% | -4.08% | -2.32% | - | +2.37% | +5.20% | +8.84% |
| Change | -13.52 | -8.29 | -4.72 | - | +4.83 | +10.57 | +17.98 |
| Level | Minor | Major | Major | - | Major | Major | Major |
Pivot points can also be used to set your price objectives. Here is the price situation in relation to pivot points:
| Pivot points | S3 | S2 | S1 | PP | R1 | R2 | R3 |
|---|---|---|---|---|---|---|---|
| Standard | 199.37 | 200.24 | 201.83 | 202.70 | 204.29 | 205.16 | 206.75 |
| Camarilla | 202.74 | 202.97 | 203.20 | 203.42 | 203.65 | 203.87 | 204.10 |
| Woodie | 199.73 | 200.42 | 202.19 | 202.88 | 204.65 | 205.34 | 207.11 |
| Fibonacci | 200.24 | 201.18 | 201.76 | 202.70 | 203.64 | 204.22 | 205.16 |
| Pivot points | S3 | S2 | S1 | PP | R1 | R2 | R3 |
|---|---|---|---|---|---|---|---|
| Standard | 173.04 | 186.55 | 194.98 | 208.49 | 216.92 | 230.43 | 238.86 |
| Camarilla | 197.39 | 199.40 | 201.41 | 203.42 | 205.43 | 207.44 | 209.45 |
| Woodie | 170.51 | 185.28 | 192.45 | 207.22 | 214.39 | 229.16 | 236.33 |
| Fibonacci | 186.55 | 194.93 | 200.11 | 208.49 | 216.87 | 222.05 | 230.43 |
| Pivot points | S3 | S2 | S1 | PP | R1 | R2 | R3 |
|---|---|---|---|---|---|---|---|
| Standard | 165.97 | 179.42 | 188.53 | 201.98 | 211.09 | 224.54 | 233.65 |
| Camarilla | 191.43 | 193.49 | 195.56 | 197.63 | 199.70 | 201.77 | 203.83 |
| Woodie | 163.79 | 178.34 | 186.35 | 200.90 | 208.91 | 223.46 | 231.47 |
| Fibonacci | 179.42 | 188.04 | 193.37 | 201.98 | 210.60 | 215.93 | 224.54 |
Numerical data
The following is the status of technical indicators and moving averages registered at the time this technical analysis was created:
| RSI (14): | 43.96 | |
| MACD (12,26,9): | 1.4400 | |
| Directional Movement: | -10.62 | |
| AROON (14): | 78.57 | |
| DEMA (21): | 210.85 | |
| Parabolic SAR (0,02-0,02-0,2): | 221.99 | |
| Elder Ray (13): | -7.64 | |
| Super Trend (3,10): | 219.49 | |
| Zig ZAG (10): | 203.42 | |
| VORTEX (21): | 1.0200 | |
| Stochastique (14,3,5): | 38.16 | |
| TEMA (21): | 212.45 | |
| Williams %R (14): | -83.84 | |
| Chande Momentum Oscillator (20): | -1.89 | |
| Repulse (5,40,3): | 0.4500 | |
| ROCnROLL: | 2 | |
| TRIX (15,9): | 0.1100 | |
| Courbe Coppock: | 11.37 |
| MA7: | 213.13 | |
| MA20: | 207.08 | |
| MA50: | 207.16 | |
| MA100: | 209.09 | |
| MAexp7: | 210.13 | |
| MAexp20: | 209.12 | |
| MAexp50: | 208.18 | |
| MAexp100: | 207.65 | |
| Price / MA7: | -4.56% | |
| Price / MA20: | -1.77% | |
| Price / MA50: | -1.81% | |
| Price / MA100: | -2.71% | |
| Price / MAexp7: | -3.19% | |
| Price / MAexp20: | -2.73% | |
| Price / MAexp50: | -2.29% | |
| Price / MAexp100: | -2.04% |
News
The last news published on AUTODESK INC. at the time of the generation of this analysis was as follows:
- Autodesk to present at upcoming investor conferences
- AUTODESK, INC. ANNOUNCES FISCAL 2024 THIRD QUARTER RESULTS
- AI and the Design and Make Platform take the main stage at Autodesk University
- Autodesk Workshop XR Delivers Immersive Design Review Experience for the AEC Industry
- Introducing Autodesk AI for Design and Make
About author

Online


Add a comment
Comments
0 comments on the analysis AUTODESK INC. - Daily