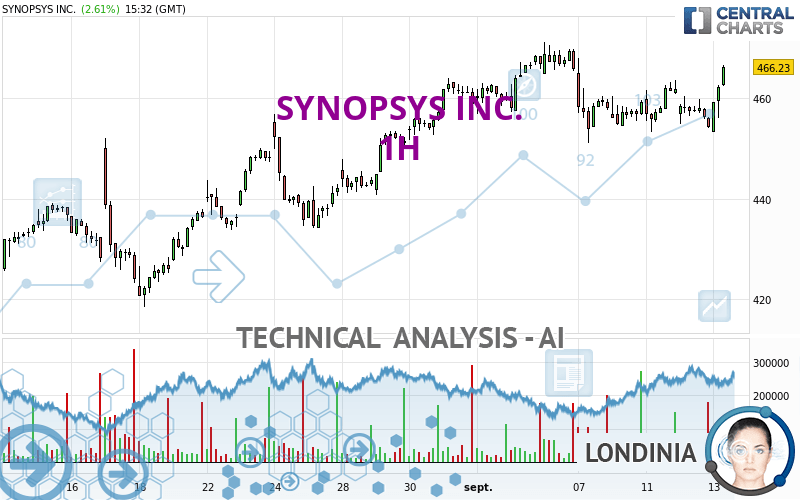
SYNOPSYS INC. - 1H - Technical analysis published on 09/13/2023 (GMT)
- 139
- 0
Click here for a new analysis!
- Timeframe : 1H
- - Analysis generated on
- Status : INVALID

Summary of the analysis

Additional analysis
Quotes
SYNOPSYS INC. rating 465.83 USD. On the day, this instrument gained +2.52% and was between 453.34 USD and 466.53 USD. This implies that the price is at +2.76% from its lowest and at -0.15% from its highest.A bearish gap was detected at the opening by the Central Gaps scanner. There are a lot of sellers and they have the upper hand in the very short term.
Opening Gap DOWN
Type : Bearish
Timeframe : Openning
Here is a more detailed summary of the historical variations registered by SYNOPSYS INC.:
Near a new HIGH record (5 years)
Type : Bullish
Timeframe : Weekly
Near a new HIGH record (1 year)
Type : Bullish
Timeframe : Weekly
Near a new HIGH record (1st january)
Type : Bullish
Timeframe : Weekly
Near a new HIGH record (1 month)
Type : Bullish
Timeframe : Weekly
Technical
Technical analysis of this 1H chart of SYNOPSYS INC. indicates that the overall trend is strongly bullish. The signals given by the moving averages are 89.29% bullish. This strong bullish trend is confirmed by the strong signals currently being given by short-term moving averages. An assessment of moving averages reveals a bullish signal that could impact this trend:
Moving Average bullish crossovers : AMA20 & AMA50
Type : Bullish
Timeframe : 1 hour
An assessment of technical indicators shows a strong bullish signal.
Caution: the Central Indicators scanner currently detects an excess:
CCI indicator is overbought : over 100
Type : Neutral
Timeframe : 1 hour
Williams %R indicator is overbought : over -20
Type : Neutral
Timeframe : 1 hour
Pivot points : price is over resistance 3
Type : Neutral
Timeframe : 1 hour
Parabolic SAR indicator bullish reversal
Type : Bullish
Timeframe : 1 hour
Aroon indicator bullish trend
Type : Bullish
Timeframe : 1 hour
SuperTrend indicator bullish reversal
Type : Bullish
Timeframe : 1 hour
MACD indicator is back over 0
Type : Bullish
Timeframe : 1 hour
Price is back over the pivot point
Type : Bullish
Timeframe : Weekly
An analysis of the price chart with the Central Patterns scanner (detector of chart patterns and resistances and supports) shows a result that can have an impact on the price change:
Near horizontal resistance
Type : Bearish
Timeframe : 1 hour
The Central Candlesticks scanner which studies Japanese candlesticks did not detect anything.
| S3 | S2 | S1 | Price | R1 | |
|---|---|---|---|---|---|
| ProTrendLines | 448.99 | 456.90 | 463.56 | 465.83 | 471.15 |
| Change (%) | -3.62% | -1.92% | -0.49% | - | +1.14% |
| Change | -16.84 | -8.93 | -2.27 | - | +5.32 |
| Level | Minor | Intermediate | Major | - | Minor |
Attention could also be paid to pivot points to set price objectives:
| Pivot points | S3 | S2 | S1 | PP | R1 | R2 | R3 |
|---|---|---|---|---|---|---|---|
| Standard | 445.69 | 449.85 | 452.11 | 456.27 | 458.53 | 462.69 | 464.95 |
| Camarilla | 452.60 | 453.18 | 453.77 | 454.36 | 454.95 | 455.54 | 456.13 |
| Woodie | 444.73 | 449.38 | 451.15 | 455.80 | 457.57 | 462.22 | 463.99 |
| Fibonacci | 449.85 | 452.31 | 453.82 | 456.27 | 458.73 | 460.24 | 462.69 |
| Pivot points | S3 | S2 | S1 | PP | R1 | R2 | R3 |
|---|---|---|---|---|---|---|---|
| Standard | 429.69 | 440.39 | 449.76 | 460.46 | 469.83 | 480.53 | 489.90 |
| Camarilla | 453.62 | 455.46 | 457.30 | 459.14 | 460.98 | 462.82 | 464.66 |
| Woodie | 429.04 | 440.06 | 449.11 | 460.13 | 469.18 | 480.20 | 489.25 |
| Fibonacci | 440.39 | 448.05 | 452.79 | 460.46 | 468.12 | 472.86 | 480.53 |
| Pivot points | S3 | S2 | S1 | PP | R1 | R2 | R3 |
|---|---|---|---|---|---|---|---|
| Standard | 384.82 | 401.66 | 430.28 | 447.12 | 475.74 | 492.58 | 521.20 |
| Camarilla | 446.39 | 450.56 | 454.72 | 458.89 | 463.06 | 467.22 | 471.39 |
| Woodie | 390.70 | 404.61 | 436.16 | 450.07 | 481.62 | 495.53 | 527.08 |
| Fibonacci | 401.66 | 419.03 | 429.76 | 447.12 | 464.49 | 475.22 | 492.58 |
Numerical data
The following is the status of the technical indicators and moving averages at the time of publication of this technical analysis:
| RSI (14): | 64.05 | |
| MACD (12,26,9): | 0.4100 | |
| Directional Movement: | 12.64 | |
| AROON (14): | 14.29 | |
| DEMA (21): | 459.49 | |
| Parabolic SAR (0,02-0,02-0,2): | 453.34 | |
| Elder Ray (13): | 4.94 | |
| Super Trend (3,10): | 453.46 | |
| Zig ZAG (10): | 465.79 | |
| VORTEX (21): | 1.1200 | |
| Stochastique (14,3,5): | 78.71 | |
| TEMA (21): | 459.81 | |
| Williams %R (14): | -10.46 | |
| Chande Momentum Oscillator (20): | 3.13 | |
| Repulse (5,40,3): | 1.9400 | |
| ROCnROLL: | 1 | |
| TRIX (15,9): | -0.0200 | |
| Courbe Coppock: | 0.67 |
| MA7: | 461.68 | |
| MA20: | 449.09 | |
| MA50: | 446.35 | |
| MA100: | 427.80 | |
| MAexp7: | 460.47 | |
| MAexp20: | 459.34 | |
| MAexp50: | 458.48 | |
| MAexp100: | 454.86 | |
| Price / MA7: | +0.90% | |
| Price / MA20: | +3.73% | |
| Price / MA50: | +4.36% | |
| Price / MA100: | +8.89% | |
| Price / MAexp7: | +1.16% | |
| Price / MAexp20: | +1.41% | |
| Price / MAexp50: | +1.60% | |
| Price / MAexp100: | +2.41% |
News
Don't forget to follow the news on SYNOPSYS INC.. At the time of publication of this analysis, the latest news was as follows:
- Synopsys Extends Synopsys.ai EDA Suite with Industry's First Full-Stack Big Data Analytics Solution
- Synopsys Initiates $300 Million Accelerated Share Repurchase Agreement
- Synopsys Completes Acquisition of PikeTec GmbH
- Synopsys to Present at Rosenblatt Tech Summit
- Synopsys Posts Financial Results for Third Quarter Fiscal Year 2023
About author
Online


Add a comment
Comments
0 comments on the analysis SYNOPSYS INC. - 1H