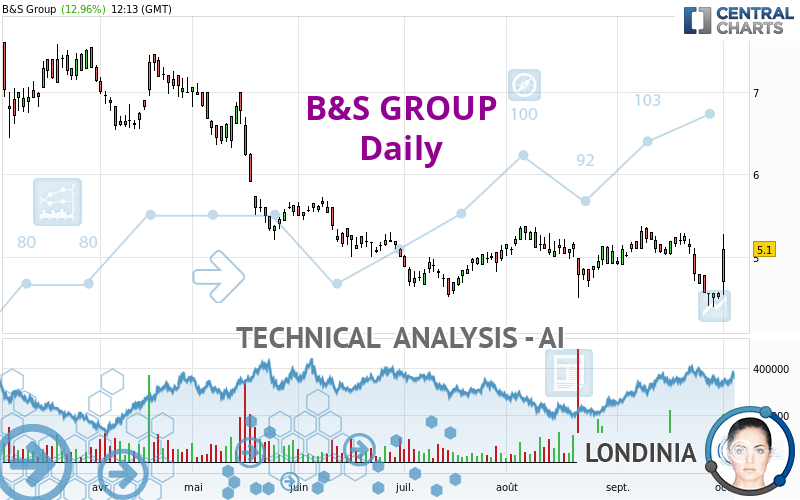
B&S GROUP - Daily - Technical analysis published on 10/03/2022 (GMT)
- 135
- 0
Click here for a new analysis!
- Timeframe : Daily
- - Analysis generated on
- Status : LEVEL MAINTAINED

Summary of the analysis

Additional analysis
Quotes
The B&S GROUP price is 5.100 EUR. On the day, this instrument gained +12.96% and was between 4.540 EUR and 5.280 EUR. This implies that the price is at +12.33% from its lowest and at -3.41% from its highest.The Central Gaps scanner detects the formation of a bullish gap marking the strong presence of buyers against sellers at the opening. This formed a quotation gap.
Opening Gap UP
Type : Bullish
Timeframe : Openning
A study of price movements over other periods shows the following variations:
Near a new LOW record (1 year)
Type : Bearish
Timeframe : Weekly
Near a new LOW record (1st january)
Type : Bearish
Timeframe : Weekly
Near a new LOW record (1 month)
Type : Bearish
Timeframe : Weekly
Technical
Technical analysis of this Daily chart of B&S GROUP indicates that the overall trend is not clearly defined. The trend could quickly turn bullish due to the strong bullish signals currently being given by short-term moving averages. An assessment of moving averages reveals several bullish signals that could impact this trend:
Bullish price crossover with Moving Average 20
Type : Bullish
Timeframe : Daily
Bullish price crossover with Moving Average 50
Type : Bullish
Timeframe : Daily
Bullish price crossover with adaptative moving average 20
Type : Bullish
Timeframe : Daily
Bullish price crossover with adaptative moving average 50
Type : Bullish
Timeframe : Daily
In fact, only 9 technical indicators out of 18 studied are currently positioned bullish. Other results related to technical indicators were also found by the Central Indicators scanner:
Pivot points : price is over resistance 2
Type : Neutral
Timeframe : Weekly
Pivot points : price is over resistance 3
Type : Neutral
Timeframe : Daily
RSI indicator is back over 50
Type : Bullish
Timeframe : Daily
Parabolic SAR indicator bullish reversal
Type : Bullish
Timeframe : Daily
Ichimoku : price is over the cloud
Type : Bullish
Timeframe : Daily
SuperTrend indicator bullish reversal
Type : Bullish
Timeframe : Daily
Momentum indicator is back over 0
Type : Bullish
Timeframe : Daily
Williams %R indicator is back over -50
Type : Bullish
Timeframe : Daily
The Central Patterns scanner, which studies chart patterns, resistances and supports, has identified this signal:
Near resistance of channel
Type : Bearish
Timeframe : Daily
For a small rebound in the very short term, the Central Candlesticks scanner currently notes the presence of this bullish pattern in Japanese candlesticks:
Long white line
Type : Bullish
Timeframe : Daily
| S2 | S1 | Price | R1 | R2 | R3 | |
|---|---|---|---|---|---|---|
| ProTrendLines | 3.735 | 4.550 | 5.100 | 5.373 | 6.598 | 7.621 |
| Change (%) | -26.76% | -10.78% | - | +5.35% | +29.37% | +49.43% |
| Change | -1.365 | -0.550 | - | +0.273 | +1.498 | +2.521 |
| Level | Minor | Major | - | Intermediate | Intermediate | Intermediate |
Pivot points can also be used to set your price objectives. Here is the price situation in relation to pivot points:
| Pivot points | S3 | S2 | S1 | PP | R1 | R2 | R3 |
|---|---|---|---|---|---|---|---|
| Standard | 4.393 | 4.442 | 4.478 | 4.527 | 4.563 | 4.612 | 4.648 |
| Camarilla | 4.492 | 4.499 | 4.507 | 4.515 | 4.523 | 4.531 | 4.538 |
| Woodie | 4.388 | 4.439 | 4.473 | 4.524 | 4.558 | 4.609 | 4.643 |
| Fibonacci | 4.442 | 4.474 | 4.494 | 4.527 | 4.559 | 4.579 | 4.612 |
| Pivot points | S3 | S2 | S1 | PP | R1 | R2 | R3 |
|---|---|---|---|---|---|---|---|
| Standard | 3.935 | 4.165 | 4.340 | 4.570 | 4.745 | 4.975 | 5.150 |
| Camarilla | 4.404 | 4.441 | 4.478 | 4.515 | 4.552 | 4.589 | 4.626 |
| Woodie | 3.908 | 4.151 | 4.313 | 4.556 | 4.718 | 4.961 | 5.123 |
| Fibonacci | 4.165 | 4.320 | 4.415 | 4.570 | 4.725 | 4.820 | 4.975 |
| Pivot points | S3 | S2 | S1 | PP | R1 | R2 | R3 |
|---|---|---|---|---|---|---|---|
| Standard | 3.162 | 3.778 | 4.147 | 4.763 | 5.132 | 5.748 | 6.117 |
| Camarilla | 4.244 | 4.334 | 4.425 | 4.515 | 4.605 | 4.696 | 4.786 |
| Woodie | 3.038 | 3.716 | 4.023 | 4.701 | 5.008 | 5.686 | 5.993 |
| Fibonacci | 3.778 | 4.155 | 4.387 | 4.763 | 5.140 | 5.372 | 5.748 |
Numerical data
The following is the status of technical indicators and moving averages registered at the time this technical analysis was created:
| RSI (14): | 54.81 | |
| MACD (12,26,9): | -0.0960 | |
| Directional Movement: | 9.857 | |
| AROON (14): | -50.000 | |
| DEMA (21): | 4.804 | |
| Parabolic SAR (0,02-0,02-0,2): | 4.395 | |
| Elder Ray (13): | 0.056 | |
| Super Trend (3,10): | 4.216 | |
| Zig ZAG (10): | 5.100 | |
| VORTEX (21): | 0.8760 | |
| Stochastique (14,3,5): | 36.80 | |
| TEMA (21): | 4.724 | |
| Williams %R (14): | -21.23 | |
| Chande Momentum Oscillator (20): | 0.060 | |
| Repulse (5,40,3): | 9.2450 | |
| ROCnROLL: | 1 | |
| TRIX (15,9): | -0.1570 | |
| Courbe Coppock: | 15.48 |
| MA7: | 4.681 | |
| MA20: | 4.999 | |
| MA50: | 5.035 | |
| MA100: | 5.115 | |
| MAexp7: | 4.786 | |
| MAexp20: | 4.909 | |
| MAexp50: | 5.024 | |
| MAexp100: | 5.285 | |
| Price / MA7: | +8.95% | |
| Price / MA20: | +2.02% | |
| Price / MA50: | +1.29% | |
| Price / MA100: | -0.29% | |
| Price / MAexp7: | +6.56% | |
| Price / MAexp20: | +3.89% | |
| Price / MAexp50: | +1.51% | |
| Price / MAexp100: | -3.50% |
News
The latest news and videos published on B&S GROUP at the time of the analysis were as follows:
-
 Steve Hilton: Biden mask policy is 'pure BS plucked out of thin air'
-
George Galloway l The Russian Bounty BS
-
Graham blasts the Dems, 'Impeachment is manufactured BS'
-
The real story (no BS) behind the US attack on Iran (full show)
- B.S.D. Crown Ltd. - TR-1: Standard form for notification of major holdings
About author
Online


Add a comment
Comments
0 comments on the analysis B&S GROUP - Daily