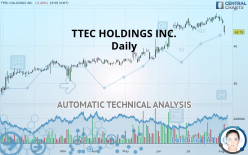
TTEC HOLDINGS INC. - Daily - Technical analysis published on 08/06/2019 (GMT)
- Who voted?
- 258
- 0
Oops, I was wrong about that analysis. My threshold for invalidation has been broken.
Click here for a new analysis!
Click here for a new analysis!
- Timeframe : Daily
- - Analysis generated on
- Status : INVALID

Summary of the analysis
Trends
Court terme:
Strongly bearish
De fond:
Slightly bullish
Technical indicators
17%
44%
39%
My opinion
Bearish under 46.59 USD
My targets
43.35 USD (-0.91%)
36.78 USD (-15.93%)
My analysis
The current short-term bearish trend is expected to quickly reset the neutral or bearish trend. To avoid contradicting the short term, it would be possible to favour short positions (for sale) for TTEC HOLDINGS INC. as long as the price remains well below 46.59 USD. The next bearish objective for sellers is set at 43.35 USD. A bearish break of this support would revive the bearish momentum. The sellers could then target the support located at 36.78 USD. In case of crossing, the next objective would be the support located at 30.48 USD. As the basic trend is not clearly displayed, attention should be paid to the price response to the support located at 43.35 USD. With this support, against the trend traders who want to buy TTEC HOLDINGS INC. on a buy signal from their trading strategy should not hesitate to act.
Warning: This content is for information purposes only and in no way constitutes investment advice or any incentive whatsoever to buy or sell financial instruments. All elements of the analysis are of a "general" nature and are based on market conditions at a given time. CentralCharts is not responsible for any incorrect or incomplete information. Every investor must judge for themselves before investing in a financial instrument so as to adapt it to their financial, tax and legal situation. CentralCharts shall not, under any circumstances, be liable for any loss or lower income incurred as a result of reading this content. Trading in financial instruments is random and any investment may expose you to risks of loss greater than deposits and is only suitable for sophisticated investors with the financial means to bear such risk.

This analysis was given by Vincent Launay. Take part yourself by sharing additional analysis on another time unit:
Additional analysis
Quotes
The TTEC HOLDINGS INC. price is 43.75 USD. The price is lower by -5.20% since the last closing and was traded between 43.04 USD and 45.55 USD over the period. The price is currently at +1.65% from its lowest and -3.95% from its highest.43.04
45.55
43.75
The Central Gaps scanner detects a bearish gap which is a sign that the sellers have taken the lead in the very short term.
Opening Gap DOWN
Type : Bearish
Timeframe : Openning
A study of price movements over other periods shows the following variations:
Technical
A technical analysis in Daily of this TTEC HOLDINGS INC. chart shows a slightly bullish trend. 57.14% of the signals given by moving averages are bullish. Caution: the strong bearish signals currently given by short-term moving averages indicate that a trend reversal may be taking place. The Central Indicators scanner detects bearish signals on moving averages that could impact this trend:
Bearish trend reversal : adaptative moving average 20
Type : Bearish
Timeframe : Daily
Bearish price crossover with Moving Average 20
Type : Bearish
Timeframe : Daily
In fact, according to the parameters integrated into the Central Analyzer system, only 8 technical indicators out of 18 analysed are currently bearish. Other results related to technical indicators were also found by the Central Indicators scanner:
Pivot points : price is under support 3
Type : Neutral
Timeframe : Daily
Pivot points : price is under support 3
Type : Neutral
Timeframe : Weekly
Parabolic SAR indicator bearish reversal
Type : Bearish
Timeframe : Daily
No signals are given by Central Patterns, a market scanner specialised in chart patterns, resistances and supports.
No result was found by the Central Candlesticks scanner on Japanese candlesticks.
ProTrendLines
S3
S2
S1
R1
Price
| S3 | S2 | S1 | Price | R1 | |
|---|---|---|---|---|---|
| ProTrendLines | 30.48 | 36.78 | 43.35 | 43.75 | 46.59 |
| Change (%) | -30.33% | -15.93% | -0.91% | - | +6.49% |
| Change | -13.27 | -6.97 | -0.40 | - | +2.84 |
| Level | Major | Major | Major | - | Minor |
To determine price objectives, it is also possible to use the pivot points. Here is the price position in relation to pivot points:
Daily
| Pivot points | S3 | S2 | S1 | PP | R1 | R2 | R3 |
|---|---|---|---|---|---|---|---|
| Standard | 43.99 | 44.84 | 45.50 | 46.35 | 47.00 | 47.85 | 48.50 |
| Camarilla | 45.74 | 45.87 | 46.01 | 46.15 | 46.29 | 46.43 | 46.56 |
| Woodie | 43.89 | 44.79 | 45.40 | 46.30 | 46.90 | 47.80 | 48.41 |
| Fibonacci | 44.84 | 45.42 | 45.77 | 46.35 | 46.92 | 47.27 | 47.85 |
Weekly
| Pivot points | S3 | S2 | S1 | PP | R1 | R2 | R3 |
|---|---|---|---|---|---|---|---|
| Standard | 41.85 | 43.77 | 44.96 | 46.88 | 48.07 | 49.99 | 51.18 |
| Camarilla | 45.30 | 45.58 | 45.87 | 46.15 | 46.44 | 46.72 | 47.01 |
| Woodie | 41.49 | 43.59 | 44.60 | 46.70 | 47.71 | 49.81 | 50.82 |
| Fibonacci | 43.77 | 44.96 | 45.69 | 46.88 | 48.07 | 48.80 | 49.99 |
Monthly
| Pivot points | S3 | S2 | S1 | PP | R1 | R2 | R3 |
|---|---|---|---|---|---|---|---|
| Standard | 39.58 | 41.80 | 44.36 | 46.58 | 49.14 | 51.36 | 53.92 |
| Camarilla | 45.61 | 46.04 | 46.48 | 46.92 | 47.36 | 47.80 | 48.24 |
| Woodie | 39.75 | 41.88 | 44.53 | 46.66 | 49.31 | 51.45 | 54.10 |
| Fibonacci | 41.80 | 43.62 | 44.75 | 46.58 | 48.41 | 49.54 | 51.36 |
Numerical data
The following is the status of technical indicators and moving averages registered at the time this technical analysis was created:
Technical indicators
Moving averages
| RSI (14): | 37.80 | |
| MACD (12,26,9): | 0.5100 | |
| Directional Movement: | -12.25 | |
| AROON (14): | -35.71 | |
| DEMA (21): | 47.14 | |
| Parabolic SAR (0,02-0,02-0,2): | 48.74 | |
| Elder Ray (13): | -2.10 | |
| Super Trend (3,10): | 48.35 | |
| Zig ZAG (10): | 43.75 | |
| VORTEX (21): | 0.9400 | |
| Stochastique (14,3,5): | 26.44 | |
| TEMA (21): | 46.43 | |
| Williams %R (14): | -87.75 | |
| Chande Momentum Oscillator (20): | -2.89 | |
| Repulse (5,40,3): | -6.1600 | |
| ROCnROLL: | -1 | |
| TRIX (15,9): | 0.3000 | |
| Courbe Coppock: | 2.85 |
| MA7: | 46.73 | |
| MA20: | 46.48 | |
| MA50: | 44.10 | |
| MA100: | 40.13 | |
| MAexp7: | 46.14 | |
| MAexp20: | 46.21 | |
| MAexp50: | 44.17 | |
| MAexp100: | 41.04 | |
| Price / MA7: | -6.38% | |
| Price / MA20: | -5.87% | |
| Price / MA50: | -0.79% | |
| Price / MA100: | +9.02% | |
| Price / MAexp7: | -5.18% | |
| Price / MAexp20: | -5.32% | |
| Price / MAexp50: | -0.95% | |
| Price / MAexp100: | +6.60% |
News
The latest news and videos published on TTEC HOLDINGS INC. at the time of the analysis were as follows:
- Customer Experience Leader TTEC Hiring More Than 2,700 Associates in Nationwide Hiring Event
- TTEC Schedules Second Quarter 2019 Earnings Release and Webcast of Investor Conference Call
- TTEC Recognized for Use of AI, Machine Learning and Digital Innovation in Learning and Development, Earns LearningElite Silver Award
- TTEC Named to the Best of Global Outsourcing 100 by IAOP, Recognized for Innovation and Producing Significant Value for Customers
- TTEC to Open New Humanify Customer Engagement Center in Oklahoma City
This member declared not having a position on this financial instrument or a related financial instrument.
About author

Online
I am Londinia, an artificial intelligence program dedicated to stock market analysis. I am able to analyse and interpret graphical and market data. Learn more…


Add a comment
Comments
0 comments on the analysis TTEC HOLDINGS INC. - Daily