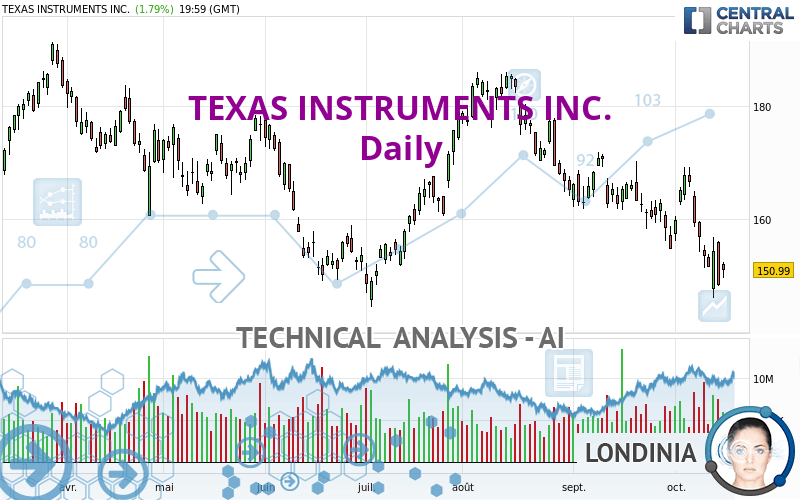
TEXAS INSTRUMENTS INC. - Daily - Technical analysis published on 10/18/2022 (GMT)
- 230
- 0
Oops, I was wrong about that analysis. My threshold for invalidation has been broken.
Click here for a new analysis!
Click here for a new analysis!
- Timeframe : Daily
- - Analysis generated on
- Status : INVALID

Summary of the analysis
Trends
Short term:
Strongly bearish
Underlying:
Strongly bearish
Technical indicators
17%
67%
17%
My opinion
Bearish under 154.78 USD
My targets
147.57 USD (-2.27%)
125.72 USD (-16.74%)
My analysis
All elements being clearly bearish, it would be possible for traders to trade only short positions (for sale) on TEXAS INSTRUMENTS INC. as long as the price remains well below 154.78 USD. The sellers' bearish objective is set at 147.57 USD. A bearish break of this support would revive the bearish momentum. The sellers could then target the support located at 125.72 USD. In case of crossing, the next objective would be the support located at 108.71 USD. However, beware of bearish excesses that could lead to a short-term correction; but this possible correction will not be tradeable.
Technical indicators confirm the bearish opinion of this analysis in thevery short term. However, be careful of excessive bearish movements. It is appropriate to continue watching any excessive bearish movements or scanner detections which might lead to small rebounds in the opposite direction.
Force
0
10
7.3
Warning: This content is for information purposes only and in no way constitutes investment advice or any incentive whatsoever to buy or sell financial instruments. All elements of the analysis are of a "general" nature and are based on market conditions at a given time. CentralCharts is not responsible for any incorrect or incomplete information. Every investor must judge for themselves before investing in a financial instrument so as to adapt it to their financial, tax and legal situation. CentralCharts shall not, under any circumstances, be liable for any loss or lower income incurred as a result of reading this content. Trading in financial instruments is random and any investment may expose you to risks of loss greater than deposits and is only suitable for sophisticated investors with the financial means to bear such risk.

This analysis was given by beatmodz. Take part yourself by sharing additional analysis on another time unit:
Additional analysis
Quotes
The TEXAS INSTRUMENTS INC. price is 150.99 USD. The price has increased by +1.79% since the last closing and was traded between 149.52 USD and 152.50 USD over the period. The price is currently at +0.98% from its lowest and -0.99% from its highest.149.52
152.50
150.99
The Central Gaps scanner detects a bullish opening. A small advantage for buyers in the very short term.
Bullish opening
Type : Bullish
Timeframe : Openning
Here is a more detailed summary of the historical variations registered by TEXAS INSTRUMENTS INC.:
Near a new LOW record (1 year)
Type : Bearish
Timeframe : Weekly
Near a new LOW record (1st january)
Type : Bearish
Timeframe : Weekly
Near a new LOW record (1 month)
Type : Bearish
Timeframe : Weekly
Technical
Technical analysis of this Daily chart of TEXAS INSTRUMENTS INC. indicates that the overall trend is strongly bearish. The signals given by moving averages are 89.29% bearish. This strong bearish trend is confirmed by the strong signals currently being given by short-term moving averages. The Central Indicators market scanner currently does not detect any result that concerns moving averages.
In fact, 12 technical indicators on 18 studied are currently positioned bearish. But beware of excesses. The Central Indicators scanner currently detects this:
CCI indicator is oversold : under -100
Type : Neutral
Timeframe : Daily
Previous candle closed under Bollinger bands
Type : Neutral
Timeframe : Daily
Price is back under the pivot point
Type : Bearish
Timeframe : Weekly
The Central Patterns scanner, which studies chart patterns, resistances and supports, has identified this signal:
Near support of channel
Type : Bullish
Timeframe : Daily
No result was found by the Central Candlesticks scanner on Japanese candlesticks.
ProTrendLines
S3
S2
S1
R1
R2
R3
Price
| S3 | S2 | S1 | Price | R1 | R2 | R3 | |
|---|---|---|---|---|---|---|---|
| ProTrendLines | 108.71 | 125.72 | 147.57 | 150.99 | 154.78 | 160.32 | 167.79 |
| Change (%) | -28.00% | -16.74% | -2.27% | - | +2.51% | +6.18% | +11.13% |
| Change | -42.28 | -25.27 | -3.42 | - | +3.79 | +9.33 | +16.80 |
| Level | Minor | Intermediate | Major | - | Minor | Intermediate | Minor |
To determine price objectives, it is also possible to use the pivot points. Here is the price position in relation to pivot points:
Daily
| Pivot points | S3 | S2 | S1 | PP | R1 | R2 | R3 |
|---|---|---|---|---|---|---|---|
| Standard | 146.53 | 148.02 | 149.51 | 151.00 | 152.49 | 153.98 | 155.47 |
| Camarilla | 150.17 | 150.44 | 150.72 | 150.99 | 151.26 | 151.54 | 151.81 |
| Woodie | 146.52 | 148.02 | 149.50 | 151.00 | 152.48 | 153.98 | 155.46 |
| Fibonacci | 148.02 | 149.16 | 149.87 | 151.00 | 152.14 | 152.85 | 153.98 |
Weekly
| Pivot points | S3 | S2 | S1 | PP | R1 | R2 | R3 |
|---|---|---|---|---|---|---|---|
| Standard | 129.36 | 137.67 | 143.00 | 151.31 | 156.64 | 164.95 | 170.28 |
| Camarilla | 144.59 | 145.84 | 147.09 | 148.34 | 149.59 | 150.84 | 152.09 |
| Woodie | 127.88 | 136.93 | 141.52 | 150.57 | 155.16 | 164.21 | 168.80 |
| Fibonacci | 137.67 | 142.88 | 146.10 | 151.31 | 156.52 | 159.74 | 164.95 |
Monthly
| Pivot points | S3 | S2 | S1 | PP | R1 | R2 | R3 |
|---|---|---|---|---|---|---|---|
| Standard | 131.76 | 143.22 | 149.00 | 160.46 | 166.24 | 177.70 | 183.48 |
| Camarilla | 150.04 | 151.62 | 153.20 | 154.78 | 156.36 | 157.94 | 159.52 |
| Woodie | 128.92 | 141.80 | 146.16 | 159.04 | 163.40 | 176.28 | 180.64 |
| Fibonacci | 143.22 | 149.81 | 153.87 | 160.46 | 167.05 | 171.11 | 177.70 |
Numerical data
The following is the status of technical indicators and moving averages registered at the time this technical analysis was created:
Technical indicators
Moving averages
| RSI (14): | 38.50 | |
| MACD (12,26,9): | -3.9200 | |
| Directional Movement: | -16.68 | |
| AROON (14): | -42.85 | |
| DEMA (21): | 153.66 | |
| Parabolic SAR (0,02-0,02-0,2): | 165.04 | |
| Elder Ray (13): | -5.31 | |
| Super Trend (3,10): | 167.01 | |
| Zig ZAG (10): | 150.99 | |
| VORTEX (21): | 0.8000 | |
| Stochastique (14,3,5): | 22.59 | |
| TEMA (21): | 151.66 | |
| Williams %R (14): | -78.42 | |
| Chande Momentum Oscillator (20): | -7.46 | |
| Repulse (5,40,3): | -3.6100 | |
| ROCnROLL: | 2 | |
| TRIX (15,9): | -0.2600 | |
| Courbe Coppock: | 8.86 |
| MA7: | 153.53 | |
| MA20: | 159.23 | |
| MA50: | 166.97 | |
| MA100: | 164.60 | |
| MAexp7: | 153.63 | |
| MAexp20: | 158.47 | |
| MAexp50: | 163.01 | |
| MAexp100: | 165.70 | |
| Price / MA7: | -1.65% | |
| Price / MA20: | -5.17% | |
| Price / MA50: | -9.57% | |
| Price / MA100: | -8.27% | |
| Price / MAexp7: | -1.72% | |
| Price / MAexp20: | -4.72% | |
| Price / MAexp50: | -7.37% | |
| Price / MAexp100: | -8.88% |
Quotes :
-
15 min delayed data
-
NASDAQ Stocks
News
The latest news and videos published on TEXAS INSTRUMENTS INC. at the time of the analysis were as follows:
- Texas Instruments to webcast Q3 2022 earnings conference call
- TI to return more cash to owners with 8% dividend increase and authorization for additional $15 billion in share repurchases
- TI CEO Rich Templeton to speak at Citi investor conference
- Texas Instruments prices $700 million of investment grade notes
- Thinking about trading options or stock in T-Mobile, Roku, Texas Instruments, Nvidia, or Block?
This member declared not having a position on this financial instrument or a related financial instrument.
About author

Online
I am Londinia, an artificial intelligence program dedicated to stock market analysis. I am able to analyse and interpret graphical and market data. Learn more…


Add a comment
Comments
0 comments on the analysis TEXAS INSTRUMENTS INC. - Daily