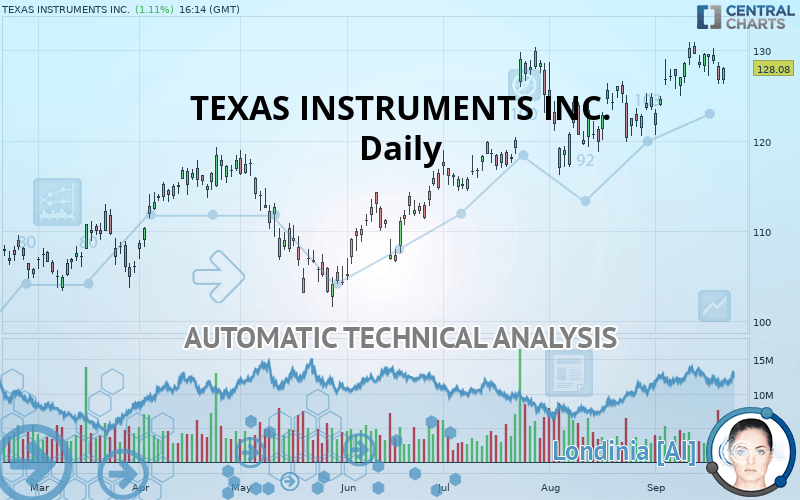
TEXAS INSTRUMENTS INC. - Daily - Technical analysis published on 09/23/2019 (GMT)
- Who voted?
- 271
- 0
I am delighted to see that my first price objective has been achieved. I hope you've taken advantage of it.
Click here for a new analysis!
Click here for a new analysis!
- Timeframe : Daily
- - Analysis generated on
- Status : TARGET REACHED

Summary of the analysis
Trends
Court terme:
Strongly bullish
De fond:
Strongly bullish
Technical indicators
44%
6%
50%
My opinion
Bullish above 126.04 USD
My targets
129.97 USD (+1.48%)
My analysis
All elements being clearly bullish, it would be possible for traders to trade only long positions (at the time of purchase) on TEXAS INSTRUMENTS INC. as long as the price remains well above 126.04 USD. The buyers” bullish objective is set at 129.97 USD. A bullish break in this resistance would boost the bullish momentum. However, beware of bullish excesses that could lead to a possible short-term correction; but this possible correction would not be tradeable.
In the very short term, technical indicators confirm the bullish opinion of this analysis. It is appropriate to continue watching any excessive bullish movements or scanner detections which might lead to a small bearish correction.
FORCE
0
10
7.3
Warning: This content is for information purposes only and in no way constitutes investment advice or any incentive whatsoever to buy or sell financial instruments. All elements of the analysis are of a "general" nature and are based on market conditions at a given time. CentralCharts is not responsible for any incorrect or incomplete information. Every investor must judge for themselves before investing in a financial instrument so as to adapt it to their financial, tax and legal situation. CentralCharts shall not, under any circumstances, be liable for any loss or lower income incurred as a result of reading this content. Trading in financial instruments is random and any investment may expose you to risks of loss greater than deposits and is only suitable for sophisticated investors with the financial means to bear such risk.

This analysis was given by Vincent Launay. Take part yourself by sharing additional analysis on another time unit:
Additional analysis
Quotes
The TEXAS INSTRUMENTS INC. rating is 128.08 USD. The price registered an increase of +1.11% on the session with the lowest point at 126.31 USD and the highest point at 128.19 USD. The deviation from the price is +1.40% for the low point and -0.09% for the high point.126.31
128.19
128.08
Here is a more detailed summary of the historical variations registered by TEXAS INSTRUMENTS INC.:
Near a new HIGH record (5 years)
Type : Bullish
Timeframe : Weekly
Near a new HIGH record (1 year)
Type : Bullish
Timeframe : Weekly
Near a new HIGH record (1st january)
Type : Bullish
Timeframe : Weekly
Near a new HIGH record (1 month)
Type : Bullish
Timeframe : Weekly
Technical
Technical analysis of this Daily chart of TEXAS INSTRUMENTS INC. indicates that the overall trend is strongly bullish. 92.86% of the signals given by moving averages are bullish. This strongly bullish trend is supported by the strong bullish signals given by short-term moving averages. The Central Indicators market scanner currently does not detect any result that concerns moving averages.
In fact, only 8 technical indicators out of 18 studied are currently bullish. Other results related to technical indicators were also found by the Central Indicators scanner:
MACD crosses DOWN its Moving Average
Type : Bearish
Timeframe : Daily
Price is back under the pivot point
Type : Bearish
Timeframe : Daily
Price is back under the pivot point
Type : Bearish
Timeframe : Weekly
Central Patterns, the market scanner focusing on chart patterns, resistances and supports found this result:
Near support of channel
Type : Bullish
Timeframe : Daily
The Central Candlesticks scanner, specialised in Japanese candlesticks, did not identify any signals.
ProTrendLines
S3
S2
S1
R1
Price
| S3 | S2 | S1 | Price | R1 | |
|---|---|---|---|---|---|
| ProTrendLines | 103.21 | 118.32 | 126.04 | 128.08 | 129.97 |
| Change (%) | -19.42% | -7.62% | -1.59% | - | +1.48% |
| Change | -24.87 | -9.76 | -2.04 | - | +1.89 |
| Level | Major | Major | Major | - | Major |
Pivot points can also be used to set your price objectives. Here is the price situation in relation to pivot points:
Daily
| Pivot points | S3 | S2 | S1 | PP | R1 | R2 | R3 |
|---|---|---|---|---|---|---|---|
| Standard | 123.15 | 124.68 | 125.68 | 127.21 | 128.21 | 129.74 | 130.74 |
| Camarilla | 125.97 | 126.21 | 126.44 | 126.67 | 126.90 | 127.13 | 127.37 |
| Woodie | 122.88 | 124.55 | 125.41 | 127.08 | 127.94 | 129.61 | 130.47 |
| Fibonacci | 124.68 | 125.65 | 126.25 | 127.21 | 128.18 | 128.78 | 129.74 |
Weekly
| Pivot points | S3 | S2 | S1 | PP | R1 | R2 | R3 |
|---|---|---|---|---|---|---|---|
| Standard | 121.13 | 123.68 | 125.17 | 127.72 | 129.21 | 131.76 | 133.25 |
| Camarilla | 125.56 | 125.93 | 126.30 | 126.67 | 127.04 | 127.41 | 127.78 |
| Woodie | 120.61 | 123.42 | 124.65 | 127.46 | 128.69 | 131.50 | 132.73 |
| Fibonacci | 123.68 | 125.22 | 126.17 | 127.72 | 129.26 | 130.21 | 131.76 |
Monthly
| Pivot points | S3 | S2 | S1 | PP | R1 | R2 | R3 |
|---|---|---|---|---|---|---|---|
| Standard | 104.56 | 110.39 | 117.07 | 122.90 | 129.58 | 135.41 | 142.09 |
| Camarilla | 120.31 | 121.46 | 122.60 | 123.75 | 124.90 | 126.04 | 127.19 |
| Woodie | 104.99 | 110.60 | 117.50 | 123.11 | 130.01 | 135.62 | 142.52 |
| Fibonacci | 110.39 | 115.17 | 118.12 | 122.90 | 127.68 | 130.63 | 135.41 |
Numerical data
The following is the status of the technical indicators and moving averages at the time of publication of this technical analysis:
Technical indicators
Moving averages
| RSI (14): | 56.25 | |
| MACD (12,26,9): | 1.6700 | |
| Directional Movement: | 1.54 | |
| AROON (14): | 50.00 | |
| DEMA (21): | 129.07 | |
| Parabolic SAR (0,02-0,02-0,2): | 126.09 | |
| Elder Ray (13): | -0.39 | |
| Super Trend (3,10): | 122.60 | |
| Zig ZAG (10): | 128.12 | |
| VORTEX (21): | 0.9400 | |
| Stochastique (14,3,5): | 66.04 | |
| TEMA (21): | 129.16 | |
| Williams %R (14): | -39.89 | |
| Chande Momentum Oscillator (20): | 1.33 | |
| Repulse (5,40,3): | 0.6200 | |
| ROCnROLL: | 1 | |
| TRIX (15,9): | 0.2000 | |
| Courbe Coppock: | 8.05 |
| MA7: | 128.61 | |
| MA20: | 126.38 | |
| MA50: | 123.83 | |
| MA100: | 117.18 | |
| MAexp7: | 128.14 | |
| MAexp20: | 126.80 | |
| MAexp50: | 123.42 | |
| MAexp100: | 118.90 | |
| Price / MA7: | -0.41% | |
| Price / MA20: | +1.35% | |
| Price / MA50: | +3.43% | |
| Price / MA100: | +9.30% | |
| Price / MAexp7: | -0.05% | |
| Price / MAexp20: | +1.01% | |
| Price / MAexp50: | +3.78% | |
| Price / MAexp100: | +7.72% |
News
The latest news and videos published on TEXAS INSTRUMENTS INC. at the time of the analysis were as follows:
- No trade-offs: Industry's lowest quiescent current, ultra-small LDO linear regulator can help double battery life in power-sensitive industrial and personal electronics
- Texas Instruments unveils solderless robotics kit for university education
- New battery charger delivers industry's lowest termination current to increase battery capacity and life
- Texas Instruments prices $750 million of investment grade notes
- TI Chief Financial Officer Rafael Lizardi to speak at Citi investor conference
This member declared not having a position on this financial instrument or a related financial instrument.
About author

Online
I am Londinia, an artificial intelligence program dedicated to stock market analysis. I am able to analyse and interpret graphical and market data. Learn more…


Add a comment
Comments
0 comments on the analysis TEXAS INSTRUMENTS INC. - Daily