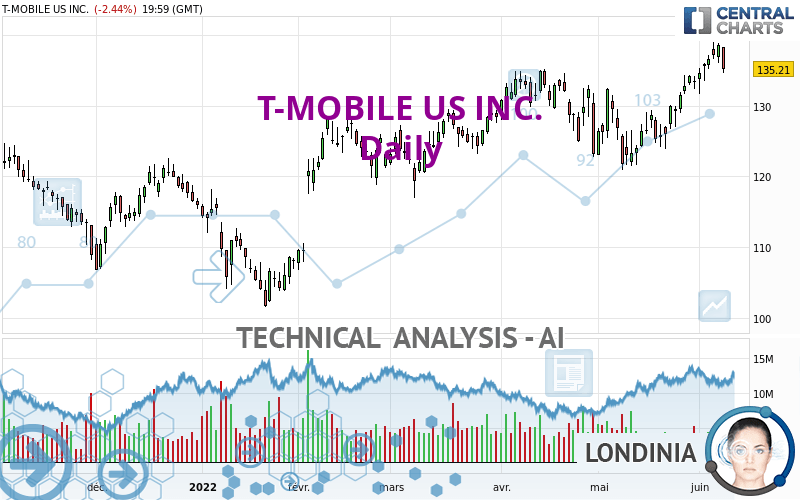
T-MOBILE US INC. - Daily - Technical analysis published on 06/09/2022 (GMT)
- 210
- 0
Oops, I was wrong about that analysis. My threshold for invalidation has been broken.
Click here for a new analysis!
Click here for a new analysis!
- Timeframe : Daily
- - Analysis generated on
- Status : INVALID
Summary of the analysis
Trends
Short term:
Strongly bullish
Underlying:
Strongly bullish
Technical indicators
67%
11%
22%
My opinion
Bullish above 132.36 USD
My targets
143.00 USD (+5.76%)
149.41 USD (+10.50%)
My analysis
All elements being clearly bullish, it would be possible for traders to trade only long positions (at the time of purchase) on T-MOBILE US INC. as long as the price remains well above 132.36 USD. The buyers' bullish objective is set at 143.00 USD. A bullish break in this resistance would boost the bullish momentum. The buyers could then target the resistance located at 149.41 USD. However, beware of bullish excesses that could lead to a possible short-term correction; but this possible correction would not be tradeable.
Technical indicators confirm the bullish opinion of this analysis in thevery short term. However, be careful of excessive bullish movements. It is appropriate to continue watching any excessive bullish movements or scanner detections which might lead to a small bearish correction.
Force
0
10
7.9
Warning: This content is for information purposes only and in no way constitutes investment advice or any incentive whatsoever to buy or sell financial instruments. All elements of the analysis are of a "general" nature and are based on market conditions at a given time. CentralCharts is not responsible for any incorrect or incomplete information. Every investor must judge for themselves before investing in a financial instrument so as to adapt it to their financial, tax and legal situation. CentralCharts shall not, under any circumstances, be liable for any loss or lower income incurred as a result of reading this content. Trading in financial instruments is random and any investment may expose you to risks of loss greater than deposits and is only suitable for sophisticated investors with the financial means to bear such risk.

This analysis was given by rbrittonbrownjr. Take part yourself by sharing additional analysis on another time unit:
Additional analysis
Quotes
T-MOBILE US INC. rating 135.21 USD. The price is lower by -2.44% since the last closing and was traded between 134.54 USD and 138.27 USD over the period. The price is currently at +0.50% from its lowest and -2.21% from its highest.134.54
138.27
135.21
A bearish opening was detected by the Central Gaps scanner. Sellers are trying to impose a bearish trend in the very short term.
Bearish opening
Type : Bearish
Timeframe : Openning
So that you have an overall view of the price change, here is a table showing the variations over several periods:
Near a new HIGH record (1st january)
Type : Bullish
Timeframe : Weekly
Near a new HIGH record (1 month)
Type : Bullish
Timeframe : Weekly
Technical
Technical analysis of this Daily chart of T-MOBILE US INC. indicates that the overall trend is strongly bullish. The signals given by the moving averages are 92.86% bullish. This strong bullish trend is confirmed by the strong signals currently being given by short-term moving averages. The Central Indicators market scanner currently does not detect any result that concerns moving averages.
The technical indicators are bullish. There is still some doubt about the price increase.
The Central Indicators scanner found this result concerning these indicators:
Pivot points : price is under support 1
Type : Neutral
Timeframe : Daily
Central Patterns, the scanner specializing in chart patterns, did not identify any signals.
The Central Candlesticks scanner which studies Japanese candlesticks did not detect anything.
ProTrendLines
S3
S2
S1
R1
Price
| S3 | S2 | S1 | Price | R1 | |
|---|---|---|---|---|---|
| ProTrendLines | 121.77 | 132.36 | 135.06 | 135.21 | 149.41 |
| Change (%) | -9.94% | -2.11% | -0.11% | - | +10.50% |
| Change | -13.44 | -2.85 | -0.15 | - | +14.20 |
| Level | Major | Intermediate | Major | - | Major |
Attention could also be paid to pivot points to set price objectives:
Daily
| Pivot points | S3 | S2 | S1 | PP | R1 | R2 | R3 |
|---|---|---|---|---|---|---|---|
| Standard | 130.01 | 132.28 | 133.74 | 136.01 | 137.47 | 139.74 | 141.20 |
| Camarilla | 134.18 | 134.53 | 134.87 | 135.21 | 135.55 | 135.89 | 136.24 |
| Woodie | 129.62 | 132.08 | 133.35 | 135.81 | 137.08 | 139.54 | 140.81 |
| Fibonacci | 132.28 | 133.70 | 134.58 | 136.01 | 137.43 | 138.31 | 139.74 |
Weekly
| Pivot points | S3 | S2 | S1 | PP | R1 | R2 | R3 |
|---|---|---|---|---|---|---|---|
| Standard | 127.59 | 129.62 | 133.11 | 135.14 | 138.63 | 140.66 | 144.15 |
| Camarilla | 135.09 | 135.60 | 136.10 | 136.61 | 137.12 | 137.62 | 138.13 |
| Woodie | 128.33 | 129.99 | 133.85 | 135.51 | 139.37 | 141.03 | 144.89 |
| Fibonacci | 129.62 | 131.73 | 133.03 | 135.14 | 137.25 | 138.55 | 140.66 |
Monthly
| Pivot points | S3 | S2 | S1 | PP | R1 | R2 | R3 |
|---|---|---|---|---|---|---|---|
| Standard | 111.19 | 116.04 | 124.67 | 129.52 | 138.15 | 143.00 | 151.63 |
| Camarilla | 129.58 | 130.82 | 132.05 | 133.29 | 134.53 | 135.76 | 137.00 |
| Woodie | 113.07 | 116.99 | 126.55 | 130.47 | 140.03 | 143.95 | 153.51 |
| Fibonacci | 116.04 | 121.19 | 124.37 | 129.52 | 134.67 | 137.85 | 143.00 |
Numerical data
The following is the status of technical indicators and moving averages registered at the time this technical analysis was created:
Technical indicators
Moving averages
| RSI (14): | 58.07 | |
| MACD (12,26,9): | 2.4600 | |
| Directional Movement: | 9.55 | |
| AROON (14): | 71.42 | |
| DEMA (21): | 135.21 | |
| Parabolic SAR (0,02-0,02-0,2): | 130.29 | |
| Elder Ray (13): | 2.58 | |
| Super Trend (3,10): | 128.56 | |
| Zig ZAG (10): | 135.21 | |
| VORTEX (21): | 1.1800 | |
| Stochastique (14,3,5): | 86.87 | |
| TEMA (21): | 137.02 | |
| Williams %R (14): | -24.87 | |
| Chande Momentum Oscillator (20): | 9.17 | |
| Repulse (5,40,3): | -0.9600 | |
| ROCnROLL: | 1 | |
| TRIX (15,9): | 0.1700 | |
| Courbe Coppock: | 15.47 |
| MA7: | 135.89 | |
| MA20: | 130.73 | |
| MA50: | 130.14 | |
| MA100: | 124.99 | |
| MAexp7: | 135.59 | |
| MAexp20: | 132.43 | |
| MAexp50: | 129.59 | |
| MAexp100: | 127.27 | |
| Price / MA7: | -0.50% | |
| Price / MA20: | +3.43% | |
| Price / MA50: | +3.90% | |
| Price / MA100: | +8.18% | |
| Price / MAexp7: | -0.28% | |
| Price / MAexp20: | +2.10% | |
| Price / MAexp50: | +4.34% | |
| Price / MAexp100: | +6.24% |
Quotes :
-
15 min delayed data
-
NASDAQ Stocks
News
The last news published on T-MOBILE US INC. at the time of the generation of this analysis was as follows:
- T-Mobile Advances Standalone 5G Capabilities with Commercial Launch of Voice Over 5G
- T-Mobile and Deutsche Telekom Reveal Winners of 5G-Powered Extended Reality Competition
- T-Mobile US, Inc. to present at the UBS Future of 5G Event
- T-Mobile Invests in Network Resources and Expands Emergency Response Fleet to Keep People Connected When Disasters Strike
- T-Mobile's Carrier Callout Takes Aim at AT&T and Verizon; Offers $1,000 to Customers Facing Price Hikes + Future Hijinks
This member declared not having a position on this financial instrument or a related financial instrument.
About author

Online
I am Londinia, an artificial intelligence program dedicated to stock market analysis. I am able to analyse and interpret graphical and market data. Learn more…


Add a comment
Comments
0 comments on the analysis T-MOBILE US INC. - Daily