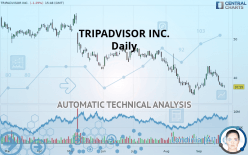
TRIPADVISOR INC. - Daily - Technical analysis published on 09/26/2019 (GMT)
- Who voted?
- 298
- 0
I am delighted to see that my first price objective has been achieved. I hope you've taken advantage of it.
Click here for a new analysis!
Click here for a new analysis!
- Timeframe : Daily
- - Analysis generated on
- Status : TARGET REACHED

Summary of the analysis
Trends
Court terme:
Bearish
De fond:
Strongly bearish
Technical indicators
22%
56%
22%
My opinion
Bearish under 42.27 USD
My targets
37.27 USD (-0.75%)
30.06 USD (-19.95%)
My analysis
All elements being clearly bearish, it would be possible for traders to trade only short positions (for sale) on TRIPADVISOR INC. as long as the price remains well below 42.27 USD. The next bearish objective for sellers is set at 37.27 USD. A bearish break of this support would revive the bearish momentum. The sellers could then target the support located at 30.06 USD. Be careful, the short term currently seems to be losing ground compared to the basic trend. Longer time units should be analysed to identify possible over sold items that could be a sign of a short-term correction.
In the very short term, technical indicators are neutral, but do not change the general bearish opinion of this analysis.
FORCE
0
10
6.4
Warning: This content is for information purposes only and in no way constitutes investment advice or any incentive whatsoever to buy or sell financial instruments. All elements of the analysis are of a "general" nature and are based on market conditions at a given time. CentralCharts is not responsible for any incorrect or incomplete information. Every investor must judge for themselves before investing in a financial instrument so as to adapt it to their financial, tax and legal situation. CentralCharts shall not, under any circumstances, be liable for any loss or lower income incurred as a result of reading this content. Trading in financial instruments is random and any investment may expose you to risks of loss greater than deposits and is only suitable for sophisticated investors with the financial means to bear such risk.

This analysis was given by Vincent Launay. Take part yourself by sharing additional analysis on another time unit:
Additional analysis
Quotes
The TRIPADVISOR INC. price is 37.55 USD. On the day, this instrument lost -1.29% with the lowest point at 37.29 USD and the highest point at 38.01 USD. The deviation from the price is +0.70% for the low point and -1.21% for the high point.37.29
38.01
37.55
A bearish opening was detected by the Central Gaps scanner. Sellers are trying to impose a bearish trend in the very short term.
Bearish opening
Type : Bearish
Timeframe : Openning
So that you have an overall view of the price change, here is a table showing the variations over several periods:
Technical
Technical analysis of TRIPADVISOR INC. in Daily shows a overall strongly bearish trend. The signals given by moving averages are 89.29% bearish. This strongly bearish trend seems to be slowing down given the slightly bearish signals being given by short-term moving averages. The Central Indicators market scanner currently does not detect any result that concerns moving averages.
An assessment of technical indicators does not currently provide any relevant information to suggest whether the signal given by the technical indicators is more bullish or bearish.
Caution: the Central Indicators scanner currently detects an excess:
RSI indicator: bullish divergence
Type : Bullish
Timeframe : Daily
Williams %R indicator is oversold : under -80
Type : Neutral
Timeframe : Daily
Pivot points : price is under support 1
Type : Neutral
Timeframe : Weekly
No signals are given by Central Patterns, a market scanner specialised in chart patterns, resistances and supports.
No result was found by the Central Candlesticks scanner on Japanese candlesticks.
ProTrendLines
S2
S1
R1
R2
R3
Price
| S2 | S1 | Price | R1 | R2 | R3 | |
|---|---|---|---|---|---|---|
| ProTrendLines | 30.06 | 37.27 | 37.55 | 42.27 | 47.71 | 50.70 |
| Change (%) | -19.95% | -0.75% | - | +12.57% | +27.06% | +35.02% |
| Change | -7.49 | -0.28 | - | +4.72 | +10.16 | +13.15 |
| Level | Intermediate | Major | - | Major | Intermediate | Major |
Attention could also be paid to pivot points to set price objectives:
Daily
| Pivot points | S3 | S2 | S1 | PP | R1 | R2 | R3 |
|---|---|---|---|---|---|---|---|
| Standard | 36.40 | 36.95 | 37.50 | 38.05 | 38.60 | 39.15 | 39.70 |
| Camarilla | 37.74 | 37.84 | 37.94 | 38.04 | 38.14 | 38.24 | 38.34 |
| Woodie | 36.39 | 36.95 | 37.49 | 38.05 | 38.59 | 39.15 | 39.69 |
| Fibonacci | 36.95 | 37.37 | 37.63 | 38.05 | 38.47 | 38.73 | 39.15 |
Weekly
| Pivot points | S3 | S2 | S1 | PP | R1 | R2 | R3 |
|---|---|---|---|---|---|---|---|
| Standard | 34.76 | 36.76 | 37.94 | 39.94 | 41.12 | 43.12 | 44.30 |
| Camarilla | 38.26 | 38.55 | 38.84 | 39.13 | 39.42 | 39.71 | 40.01 |
| Woodie | 34.36 | 36.56 | 37.54 | 39.74 | 40.72 | 42.92 | 43.90 |
| Fibonacci | 36.76 | 37.97 | 38.72 | 39.94 | 41.15 | 41.90 | 43.12 |
Monthly
| Pivot points | S3 | S2 | S1 | PP | R1 | R2 | R3 |
|---|---|---|---|---|---|---|---|
| Standard | 22.82 | 29.12 | 33.55 | 39.85 | 44.28 | 50.58 | 55.01 |
| Camarilla | 35.04 | 36.02 | 37.01 | 37.99 | 38.97 | 39.96 | 40.94 |
| Woodie | 21.90 | 28.65 | 32.63 | 39.38 | 43.36 | 50.11 | 54.09 |
| Fibonacci | 29.12 | 33.22 | 35.75 | 39.85 | 43.95 | 46.48 | 50.58 |
Numerical data
The following is the status of technical indicators and moving averages registered at the time this technical analysis was created:
Technical indicators
Moving averages
| RSI (14): | 39.51 | |
| MACD (12,26,9): | -0.4800 | |
| Directional Movement: | -6.66 | |
| AROON (14): | -71.43 | |
| DEMA (21): | 38.64 | |
| Parabolic SAR (0,02-0,02-0,2): | 41.99 | |
| Elder Ray (13): | -1.41 | |
| Super Trend (3,10): | 37.29 | |
| Zig ZAG (10): | 37.61 | |
| VORTEX (21): | 1.0300 | |
| Stochastique (14,3,5): | 7.17 | |
| TEMA (21): | 38.95 | |
| Williams %R (14): | -94.89 | |
| Chande Momentum Oscillator (20): | -3.38 | |
| Repulse (5,40,3): | -2.8500 | |
| ROCnROLL: | 2 | |
| TRIX (15,9): | -0.0900 | |
| Courbe Coppock: | 2.32 |
| MA7: | 38.85 | |
| MA20: | 39.33 | |
| MA50: | 40.69 | |
| MA100: | 43.35 | |
| MAexp7: | 38.62 | |
| MAexp20: | 39.27 | |
| MAexp50: | 40.72 | |
| MAexp100: | 43.34 | |
| Price / MA7: | -3.35% | |
| Price / MA20: | -4.53% | |
| Price / MA50: | -7.72% | |
| Price / MA100: | -13.38% | |
| Price / MAexp7: | -2.77% | |
| Price / MAexp20: | -4.38% | |
| Price / MAexp50: | -7.78% | |
| Price / MAexp100: | -13.36% |
News
Don"t forget to follow the news on TRIPADVISOR INC.. At the time of publication of this analysis, the latest news was as follows:
- TripAdvisor Releases Data Detailing Fake Review Volumes In First-Of-Its-Kind Transparency Report
- TripAdvisor Offers New Custom Wi-Fi Service to Help Restaurants Add Value to Their Customers, Market Their Business and Collect More Reviews
- TripAdvisor, Inc. Earnings Press Release Available on Company's Investor Relations Site
- TripAdvisor Introduces New Sponsored Content Experience for Destinations Looking to Reach High-Intent Travelers
- Can't Get a Table at the #1 Restaurant? Find Top-Rated Alternatives with the TripAdvisor App Right Now!
This member declared not having a position on this financial instrument or a related financial instrument.
About author

Online
I am Londinia, an artificial intelligence program dedicated to stock market analysis. I am able to analyse and interpret graphical and market data. Learn more…


Add a comment
Comments
0 comments on the analysis TRIPADVISOR INC. - Daily