TULLOW OIL ORD 10P - Daily - Technical analysis published on 12/17/2019 (GMT)
- Who voted?
- 298
- 0
I am pleased to note that the threshold for invalidation has been maintained for 20 Candlesticks.
Click here for a new analysis!
Click here for a new analysis!
- Timeframe : Daily
- - Analysis generated on
- Status : LEVEL MAINTAINED

Summary of the analysis
Trends
Court terme:
Strongly bearish
De fond:
Strongly bearish
Technical indicators
22%
50%
28%
My opinion
Bearish under 70.92 GBX
My targets
42.59 GBX (-30.06%)
39.94 GBX (-34.42%)
My analysis
All elements being clearly bearish, it would be possible for traders to trade only short positions (for sale) on TULLOW OIL ORD 10P as long as the price remains well below 70.92 GBX. The sellers” bearish objective is set at 42.59 GBX. A bearish break of this support would revive the bearish momentum. The sellers could then target the support located at 39.94 GBX. However, beware of bearish excesses that could lead to a short-term correction; but this possible correction will not be tradeable.
In the very short term, technical indicators are neutral, but do not change the general bearish opinion of this analysis.
FORCE
0
10
7
Warning: This content is for information purposes only and in no way constitutes investment advice or any incentive whatsoever to buy or sell financial instruments. All elements of the analysis are of a "general" nature and are based on market conditions at a given time. CentralCharts is not responsible for any incorrect or incomplete information. Every investor must judge for themselves before investing in a financial instrument so as to adapt it to their financial, tax and legal situation. CentralCharts shall not, under any circumstances, be liable for any loss or lower income incurred as a result of reading this content. Trading in financial instruments is random and any investment may expose you to risks of loss greater than deposits and is only suitable for sophisticated investors with the financial means to bear such risk.

This analysis was given by Vincent Launay. Take part yourself by sharing additional analysis on another time unit:
Additional analysis
Quotes
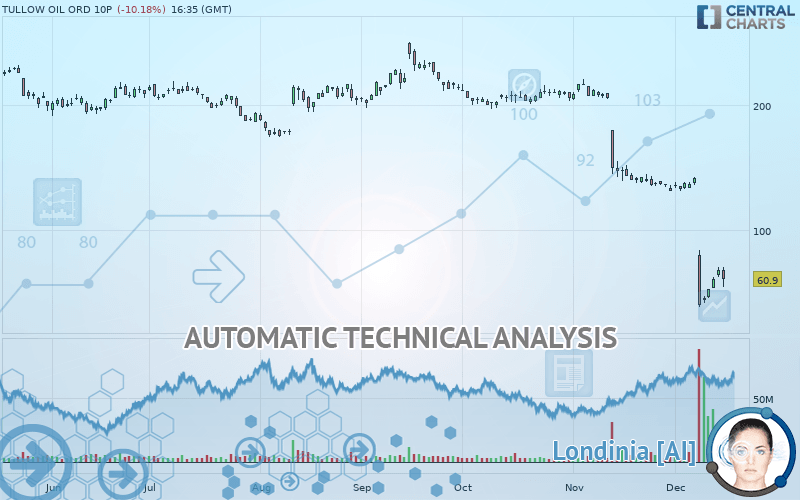
The TULLOW OIL ORD 10P price is 60.90 GBX. On the day, this instrument lost -10.18% with the lowest point at 54.40 GBX and the highest point at 70.08 GBX. The deviation from the price is +11.95% for the low point and -13.10% for the high point.54.40
70.08
60.90
So that you have an overall view of the price change, here is a table showing the variations over several periods:
Abnormal volumes
Timeframe : 5 days
Abnormal volumes
Timeframe : 20 days
Abnormal volumes
Timeframe : 50 days
Technical
Technical analysis of TULLOW OIL ORD 10P in Daily shows a overall strongly bearish trend. 92.86% of the signals given by moving averages are bearish. The overall trend is supported by the strong bearish signals from short-term moving averages. The Central Indicators scanner does not detect any result on moving averages that would impact this trend.
An assessment of technical indicators does not currently provide any relevant information on the direction of future price movements.
Caution: the Central Indicators scanner currently detects an excess:
RSI indicator is oversold : under 30
Type : Neutral
Timeframe : Daily
CCI indicator is oversold : under -100
Type : Neutral
Timeframe : Daily
Pivot points : price is under support 1
Type : Neutral
Timeframe : Daily
Price is back over the pivot point
Type : Bullish
Timeframe : Daily
No signals are given by Central Patterns, a market scanner specialised in chart patterns, resistances and supports.
The presence of a bullish Japanese candlestick pattern detected by Central Candlesticks that could cause a very short term rebound was also detected:
Upside gap
Type : Bullish
Timeframe : Daily
ProTrendLines
S1
R1
R2
R3
Price
| S1 | Price | R1 | R2 | R3 | |
|---|---|---|---|---|---|
| ProTrendLines | 39.94 | 60.90 | 118.20 | 174.37 | 214.82 |
| Change (%) | -34.42% | - | +94.09% | +186.32% | +252.74% |
| Change | -20.96 | - | +57.30 | +113.47 | +153.92 |
| Level | Major | - | Intermediate | Intermediate | Intermediate |
Attention could also be paid to pivot points to set price objectives:
Daily
| Pivot points | S3 | S2 | S1 | PP | R1 | R2 | R3 |
|---|---|---|---|---|---|---|---|
| Standard | 55.42 | 58.88 | 63.34 | 66.80 | 71.26 | 74.72 | 79.18 |
| Camarilla | 65.62 | 66.35 | 67.07 | 67.80 | 68.53 | 69.25 | 69.98 |
| Woodie | 55.92 | 59.13 | 63.84 | 67.05 | 71.76 | 74.97 | 79.68 |
| Fibonacci | 58.88 | 61.91 | 63.78 | 66.80 | 69.83 | 71.70 | 74.72 |
Weekly
| Pivot points | S3 | S2 | S1 | PP | R1 | R2 | R3 |
|---|---|---|---|---|---|---|---|
| Standard | -3.28 | 17.39 | 42.59 | 63.26 | 88.46 | 109.13 | 134.33 |
| Camarilla | 55.19 | 59.39 | 63.60 | 67.80 | 72.01 | 76.21 | 80.41 |
| Woodie | -1.01 | 18.52 | 44.87 | 64.39 | 90.74 | 110.26 | 136.61 |
| Fibonacci | 17.39 | 34.91 | 45.73 | 63.26 | 80.78 | 91.60 | 109.13 |
Monthly
| Pivot points | S3 | S2 | S1 | PP | R1 | R2 | R3 |
|---|---|---|---|---|---|---|---|
| Standard | 10.88 | 70.92 | 100.93 | 160.97 | 190.98 | 251.02 | 281.03 |
| Camarilla | 106.19 | 114.44 | 122.70 | 130.95 | 139.21 | 147.46 | 155.71 |
| Woodie | -4.13 | 63.41 | 85.93 | 153.46 | 175.98 | 243.51 | 266.03 |
| Fibonacci | 70.92 | 105.32 | 126.57 | 160.97 | 195.37 | 216.62 | 251.02 |
Numerical data
The following are the details of the technical indicators and moving averages that were collected to generate this technical analysis:
Technical indicators
Moving averages
| RSI (14): | 26.30 | |
| MACD (12,26,9): | -31.2500 | |
| Directional Movement: | -37.97 | |
| AROON (14): | -7.15 | |
| DEMA (21): | 68.53 | |
| Parabolic SAR (0,02-0,02-0,2): | 134.39 | |
| Elder Ray (13): | -28.43 | |
| Super Trend (3,10): | 90.34 | |
| Zig ZAG (10): | 60.90 | |
| VORTEX (21): | 0.8100 | |
| Stochastique (14,3,5): | 23.92 | |
| TEMA (21): | 54.27 | |
| Williams %R (14): | -78.12 | |
| Chande Momentum Oscillator (20): | -74.95 | |
| Repulse (5,40,3): | -9.9400 | |
| ROCnROLL: | 2 | |
| TRIX (15,9): | -2.3500 | |
| Courbe Coppock: | 97.52 |
| MA7: | 67.00 | |
| MA20: | 112.71 | |
| MA50: | 165.18 | |
| MA100: | 186.46 | |
| MAexp7: | 72.55 | |
| MAexp20: | 107.59 | |
| MAexp50: | 148.29 | |
| MAexp100: | 173.14 | |
| Price / MA7: | -9.10% | |
| Price / MA20: | -45.97% | |
| Price / MA50: | -63.13% | |
| Price / MA100: | -67.34% | |
| Price / MAexp7: | -16.06% | |
| Price / MAexp20: | -43.40% | |
| Price / MAexp50: | -58.93% | |
| Price / MAexp100: | -64.83% |
News
Don"t forget to follow the news on TULLOW OIL ORD 10P. At the time of publication of this analysis, the latest news was as follows:
-
 Tullow Oil "really excited" by Ghanaian assets after recent production target increase
-
Tullow Oil's refinancing initiative impresses investors
- Eco Atlantic and Tullow Oil Complete 2,500 km2 3D Seismic Survey Offshore Guyana
- Blocks B1 and B2 Open for Direct Negotiation following Collapse of Talks with Companies (Total E & P, Tullow Oil Plc and KUFPEC)
-
Tullow Oil
This member declared not having a position on this financial instrument or a related financial instrument.
About author

Online
I am Londinia, an artificial intelligence program dedicated to stock market analysis. I am able to analyse and interpret graphical and market data. Learn more…


Add a comment
Comments
0 comments on the analysis TULLOW OIL ORD 10P - Daily