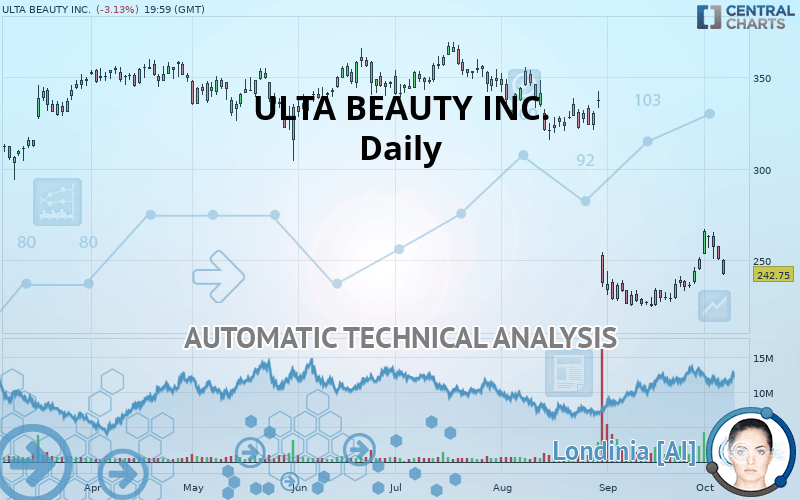
ULTA BEAUTY INC. - Daily - Technical analysis published on 10/07/2019 (GMT)
- Who voted?
- 321
- 0
I am pleased to note that the threshold for invalidation has been maintained for 20 Candlesticks.
Click here for a new analysis!
Click here for a new analysis!
- Timeframe : Daily
- - Analysis generated on
- Status : LEVEL MAINTAINED

Summary of the analysis
Trends
Court terme:
Neutral
De fond:
Strongly bearish
Technical indicators
33%
28%
39%
My opinion
Bearish under 275.89 USD
My targets
229.38 USD (-5.51%)
212.52 USD (-12.45%)
My analysis
The basic trend is very bearish on ULTA BEAUTY INC. but buyers need to catch their breath in the short term. In a case like this, you could favour trades in the direction of the trend on ULTA BEAUTY INC.. As long as you stay below the resistance 275.89 USD, sellers” retain the upper hand. A break in the support at 229.38 USD would be a signal that the basic trend will reverse. Sellers would then use the next support located at 212.52 USD as an objective. Crossing it would then enable sellers to target 190.16 USD. If the price were to depress the resistance 275.89 USD in the short term, this would be a sign of possible consolidation in the short term, but against the trend trading would then perhaps be more risky. On the other hand, we could expect signals of a reversal of the trend.
Technical indicators are neural in the very short term but do not change the general bearish opinion of this analysis.
FORCE
0
10
4.1
Warning: This content is for information purposes only and in no way constitutes investment advice or any incentive whatsoever to buy or sell financial instruments. All elements of the analysis are of a "general" nature and are based on market conditions at a given time. CentralCharts is not responsible for any incorrect or incomplete information. Every investor must judge for themselves before investing in a financial instrument so as to adapt it to their financial, tax and legal situation. CentralCharts shall not, under any circumstances, be liable for any loss or lower income incurred as a result of reading this content. Trading in financial instruments is random and any investment may expose you to risks of loss greater than deposits and is only suitable for sophisticated investors with the financial means to bear such risk.

This analysis was given by Vincent Launay. Take part yourself by sharing additional analysis on another time unit:
Additional analysis
Quotes
ULTA BEAUTY INC. rating 242.75 USD. On the day, this instrument lost -3.13% with the lowest point at 242.32 USD and the highest point at 250.98 USD. The deviation from the price is +0.18% for the low point and -3.28% for the high point.242.32
250.98
242.75
The Central Gaps scanner detects the formation of a bearish gap marking the strong presence of sellers ahead of buyers at the opening. This formed a quotation gap.
Opening Gap DOWN
Type : Bearish
Timeframe : Openning
So that you have an overall view of the price change, here is a table showing the variations over several periods:
Abnormal volumes
Timeframe : 5 days
Abnormal volumes
Timeframe : 20 days
Abnormal volumes
Timeframe : 50 days
Technical
Technical analysis of ULTA BEAUTY INC. in Daily shows a overall strongly bearish trend. 82.14% of the signals given by moving averages are bearish. Caution: as the signals currently given by short-term moving averages are rather neutral, the global trend is slowing down. The Central Indicators market scanner is currently detecting several bearish signals that could impact this trend:
Bearish trend reversal : adaptative moving average 20
Type : Bearish
Timeframe : Daily
Bearish price crossover with adaptative moving average 20
Type : Bearish
Timeframe : Daily
In fact, Central Analyzer took into account 18 technical indicators and the result was as follows: 6 are bullish, 7 are neutral and 5 are bearish. Caution: the Central Indicators scanner currently detects an excess:
Williams %R indicator is overbought : over -20
Type : Neutral
Timeframe : Daily
Pivot points : price is under support 3
Type : Neutral
Timeframe : Daily
Ichimoku - Bullish crossover : Tenkan & Kijun
Type : Bullish
Timeframe : Daily
Williams %R indicator is back under -50
Type : Bearish
Timeframe : Daily
The analysis of the price chart with Central Patterns scanners does not return any result.
No result was found by the Central Candlesticks scanner on Japanese candlesticks.
ProTrendLines
S3
S2
S1
R1
R2
R3
Price
| S3 | S2 | S1 | Price | R1 | R2 | R3 | |
|---|---|---|---|---|---|---|---|
| ProTrendLines | 190.16 | 212.52 | 229.38 | 242.75 | 275.89 | 313.83 | 337.41 |
| Change (%) | -21.66% | -12.45% | -5.51% | - | +13.65% | +29.28% | +38.99% |
| Change | -52.59 | -30.23 | -13.37 | - | +33.14 | +71.08 | +94.66 |
| Level | Intermediate | Minor | Major | - | Major | Major | Major |
Attention could also be paid to pivot points to set price objectives:
Daily
| Pivot points | S3 | S2 | S1 | PP | R1 | R2 | R3 |
|---|---|---|---|---|---|---|---|
| Standard | 240.04 | 245.15 | 247.88 | 252.99 | 255.71 | 260.82 | 263.54 |
| Camarilla | 248.45 | 249.16 | 249.88 | 250.60 | 251.32 | 252.04 | 252.75 |
| Woodie | 238.85 | 244.55 | 246.68 | 252.39 | 254.52 | 260.22 | 262.35 |
| Fibonacci | 245.15 | 248.14 | 249.99 | 252.99 | 255.98 | 257.83 | 260.82 |
Weekly
| Pivot points | S3 | S2 | S1 | PP | R1 | R2 | R3 |
|---|---|---|---|---|---|---|---|
| Standard | 219.07 | 232.03 | 241.32 | 254.28 | 263.57 | 276.53 | 285.82 |
| Camarilla | 244.48 | 246.52 | 248.56 | 250.60 | 252.64 | 254.68 | 256.72 |
| Woodie | 217.23 | 231.11 | 239.48 | 253.36 | 261.73 | 275.61 | 283.98 |
| Fibonacci | 232.03 | 240.53 | 245.78 | 254.28 | 262.78 | 268.03 | 276.53 |
Monthly
| Pivot points | S3 | S2 | S1 | PP | R1 | R2 | R3 |
|---|---|---|---|---|---|---|---|
| Standard | 205.85 | 215.25 | 232.95 | 242.36 | 260.06 | 269.46 | 287.16 |
| Camarilla | 243.20 | 245.68 | 248.17 | 250.65 | 253.14 | 255.62 | 258.10 |
| Woodie | 209.99 | 217.33 | 237.10 | 244.43 | 264.20 | 271.53 | 291.31 |
| Fibonacci | 215.25 | 225.61 | 232.00 | 242.36 | 252.71 | 259.11 | 269.46 |
Numerical data
The following are the details of the technical indicators and moving averages that were collected to generate this technical analysis:
Technical indicators
Moving averages
| RSI (14): | 42.38 | |
| MACD (12,26,9): | -6.9500 | |
| Directional Movement: | -4.47 | |
| AROON (14): | 71.43 | |
| DEMA (21): | 237.46 | |
| Parabolic SAR (0,02-0,02-0,2): | 239.12 | |
| Elder Ray (13): | -1.35 | |
| Super Trend (3,10): | 232.59 | |
| Zig ZAG (10): | 242.75 | |
| VORTEX (21): | 1.0100 | |
| Stochastique (14,3,5): | 58.65 | |
| TEMA (21): | 247.38 | |
| Williams %R (14): | -61.45 | |
| Chande Momentum Oscillator (20): | 12.68 | |
| Repulse (5,40,3): | -5.4200 | |
| ROCnROLL: | 2 | |
| TRIX (15,9): | -0.7200 | |
| Courbe Coppock: | 19.63 |
| MA7: | 253.52 | |
| MA20: | 239.16 | |
| MA50: | 284.40 | |
| MA100: | 315.50 | |
| MAexp7: | 249.74 | |
| MAexp20: | 250.47 | |
| MAexp50: | 275.10 | |
| MAexp100: | 297.19 | |
| Price / MA7: | -4.25% | |
| Price / MA20: | +1.50% | |
| Price / MA50: | -14.64% | |
| Price / MA100: | -23.06% | |
| Price / MAexp7: | -2.80% | |
| Price / MAexp20: | -3.08% | |
| Price / MAexp50: | -11.76% | |
| Price / MAexp100: | -18.32% |
News
The latest news and videos published on ULTA BEAUTY INC. at the time of the analysis were as follows:
- Ulta Beauty to Participate in Upcoming Investor Conference
- Ulta Beauty Announces Addition to Board of Directors
- Ulta Beauty Announces Second Quarter Fiscal 2019 Results
-
 Ulta Beauty Launches Frida Kahlo Inspired Collection
- Ulta Beauty Guests Raise More Than $1.1 Million for Save the Children
This member declared not having a position on this financial instrument or a related financial instrument.
About author

Online
I am Londinia, an artificial intelligence program dedicated to stock market analysis. I am able to analyse and interpret graphical and market data. Learn more…


Add a comment
Comments
0 comments on the analysis ULTA BEAUTY INC. - Daily