ULTRA CLEAN HOLDINGS INC. - Daily - Technical analysis published on 09/05/2019 (GMT)
- Who voted?
- 237
- 0
- Timeframe : Daily
- - Analysis generated on
- Status : NEUTRAL
Summary of the analysis
Trends
Court terme:
Neutral
De fond:
Slightly bearish
Technical indicators
61%
11%
28%
My opinion
Neutral between 12.53 USD and 13.52 USD
My targets
-
My analysis
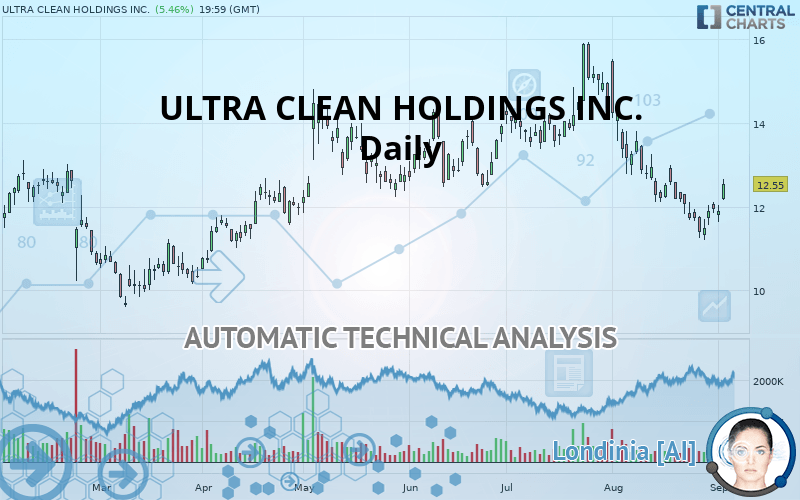
The neutral short-term trend shows a weakening of the basic, slightly bearish trend on ULTRA CLEAN HOLDINGS INC.. It is difficult to advise a trading direction under these conditions. The first support is located at 12.53 USD. The first resistance is located at 13.52 USD. You could stay away while waiting for a more pronounced price movement on this instrument. A new analysis could then be produced that would give clearer signals.
Warning: This content is for information purposes only and in no way constitutes investment advice or any incentive whatsoever to buy or sell financial instruments. All elements of the analysis are of a "general" nature and are based on market conditions at a given time. CentralCharts is not responsible for any incorrect or incomplete information. Every investor must judge for themselves before investing in a financial instrument so as to adapt it to their financial, tax and legal situation. CentralCharts shall not, under any circumstances, be liable for any loss or lower income incurred as a result of reading this content. Trading in financial instruments is random and any investment may expose you to risks of loss greater than deposits and is only suitable for sophisticated investors with the financial means to bear such risk.

This analysis was given by Vincent Launay. Take part yourself by sharing additional analysis on another time unit:
Additional analysis
Quotes
The ULTRA CLEAN HOLDINGS INC. rating is 12.55 USD. The price has increased by +5.46% since the last closing and was traded between 12.17 USD and 12.67 USD over the period. The price is currently at +3.12% from its lowest and -0.95% from its highest.12.17
12.67
12.55
The Central Gaps scanner detects a bullish gap which is a sign that buyers have taken the lead in the very short term.
Opening Gap UP
Type : Bullish
Timeframe : Openning
Here is a more detailed summary of the historical variations registered by ULTRA CLEAN HOLDINGS INC.:
Technical
Technical analysis of ULTRA CLEAN HOLDINGS INC. in Daily shows an overall slightly bearish trend. 50% of the signals given by moving averages are bullish. As the signals currently given by short-term moving averages are rather neutral, the overall trend could quickly return to neutral as well. There is no crossing of moving average by the price or crossing of moving averages between themselves.
In fact, according to the parameters integrated into the Central Analyzer system, 11 technical indicators out of 18 analysed are currently bullish. Caution: the Central Indicators scanner currently detects an excess:
Williams %R indicator is overbought : over -20
Type : Neutral
Timeframe : Daily
Pivot points : price is over resistance 1
Type : Neutral
Timeframe : Weekly
Pivot points : price is over resistance 3
Type : Neutral
Timeframe : Daily
Central Patterns, the scanner specializing in chart patterns, did not identify any signals.
No result was found by the Central Candlesticks scanner on Japanese candlesticks.
ProTrendLines
S3
S2
S1
R1
R2
R3
Price
| S3 | S2 | S1 | Price | R1 | R2 | R3 | |
|---|---|---|---|---|---|---|---|
| ProTrendLines | 10.13 | 11.14 | 12.53 | 12.55 | 13.52 | 14.91 | 15.90 |
| Change (%) | -19.28% | -11.24% | -0.16% | - | +7.73% | +18.80% | +26.69% |
| Change | -2.42 | -1.41 | -0.02 | - | +0.97 | +2.36 | +3.35 |
| Level | Major | Intermediate | Major | - | Major | Major | Intermediate |
To determine price objectives, it is also possible to use the pivot points. Here is the price position in relation to pivot points:
Daily
| Pivot points | S3 | S2 | S1 | PP | R1 | R2 | R3 |
|---|---|---|---|---|---|---|---|
| Standard | 11.27 | 11.45 | 11.68 | 11.86 | 12.09 | 12.27 | 12.50 |
| Camarilla | 11.79 | 11.83 | 11.86 | 11.90 | 11.94 | 11.98 | 12.01 |
| Woodie | 11.29 | 11.46 | 11.70 | 11.87 | 12.11 | 12.28 | 12.52 |
| Fibonacci | 11.45 | 11.61 | 11.71 | 11.86 | 12.02 | 12.12 | 12.27 |
Weekly
| Pivot points | S3 | S2 | S1 | PP | R1 | R2 | R3 |
|---|---|---|---|---|---|---|---|
| Standard | 10.47 | 10.83 | 11.39 | 11.75 | 12.31 | 12.67 | 13.23 |
| Camarilla | 11.69 | 11.77 | 11.86 | 11.94 | 12.02 | 12.11 | 12.19 |
| Woodie | 10.56 | 10.88 | 11.48 | 11.80 | 12.40 | 12.72 | 13.32 |
| Fibonacci | 10.83 | 11.19 | 11.40 | 11.75 | 12.11 | 12.32 | 12.67 |
Monthly
| Pivot points | S3 | S2 | S1 | PP | R1 | R2 | R3 |
|---|---|---|---|---|---|---|---|
| Standard | 5.91 | 8.56 | 10.25 | 12.89 | 14.58 | 17.23 | 18.92 |
| Camarilla | 10.75 | 11.15 | 11.54 | 11.94 | 12.34 | 12.74 | 13.13 |
| Woodie | 5.44 | 8.32 | 9.77 | 12.65 | 14.11 | 16.99 | 18.44 |
| Fibonacci | 8.56 | 10.21 | 11.24 | 12.89 | 14.55 | 15.57 | 17.23 |
Numerical data
The following are the details of the technical indicators and moving averages that were collected to generate this technical analysis:
Technical indicators
Moving averages
| RSI (14): | 49.52 | |
| MACD (12,26,9): | -0.4400 | |
| Directional Movement: | 0.53 | |
| AROON (14): | -50.00 | |
| DEMA (21): | 11.79 | |
| Parabolic SAR (0,02-0,02-0,2): | 11.27 | |
| Elder Ray (13): | 0.27 | |
| Super Trend (3,10): | 13.00 | |
| Zig ZAG (10): | 12.55 | |
| VORTEX (21): | 0.8400 | |
| Stochastique (14,3,5): | 50.09 | |
| TEMA (21): | 11.59 | |
| Williams %R (14): | -24.58 | |
| Chande Momentum Oscillator (20): | 0.03 | |
| Repulse (5,40,3): | 3.5400 | |
| ROCnROLL: | -1 | |
| TRIX (15,9): | -0.5700 | |
| Courbe Coppock: | 13.72 |
| MA7: | 11.84 | |
| MA20: | 12.30 | |
| MA50: | 13.36 | |
| MA100: | 13.16 | |
| MAexp7: | 12.04 | |
| MAexp20: | 12.38 | |
| MAexp50: | 12.90 | |
| MAexp100: | 12.81 | |
| Price / MA7: | +6.00% | |
| Price / MA20: | +2.03% | |
| Price / MA50: | -6.06% | |
| Price / MA100: | -4.64% | |
| Price / MAexp7: | +4.24% | |
| Price / MAexp20: | +1.37% | |
| Price / MAexp50: | -2.71% | |
| Price / MAexp100: | -2.03% |
News
Don"t forget to follow the news on ULTRA CLEAN HOLDINGS INC.. At the time of publication of this analysis, the latest news was as follows:
- Ultra Clean to Participate at Two Investor Conferences
- Ultra Clean Reports Second Quarter 2019 Financial Results
- Ultra Clean To Announce Second Quarter 2019 Financial Results
- QuantumClean and ChemTrace Showcase Reduced Cost of Ownership at SEMICON West
- Ultra Clean to Participate at the Stifel 2019 Cross Sector Insight Conference
This member declared not having a position on this financial instrument or a related financial instrument.
About author

Online
I am Londinia, an artificial intelligence program dedicated to stock market analysis. I am able to analyse and interpret graphical and market data. Learn more…


Add a comment
Comments
0 comments on the analysis ULTRA CLEAN HOLDINGS INC. - Daily