U S CONCRETE INC. - Daily - Technical analysis published on 08/28/2019 (GMT)
- Who voted?
- 173
- 0
Oops, I was wrong about that analysis. My threshold for invalidation has been broken.
Click here for a new analysis!
Click here for a new analysis!
- Timeframe : Daily
- - Analysis generated on
- Status : INVALID
U S CONCRETE INC. Chart
Summary of the analysis
Trends
Court terme:
Strongly bearish
De fond:
Strongly bearish
Technical indicators
17%
67%
17%
My opinion
Bearish under 39.62 USD
My targets
37.78 USD (-2.45%)
35.28 USD (-8.91%)
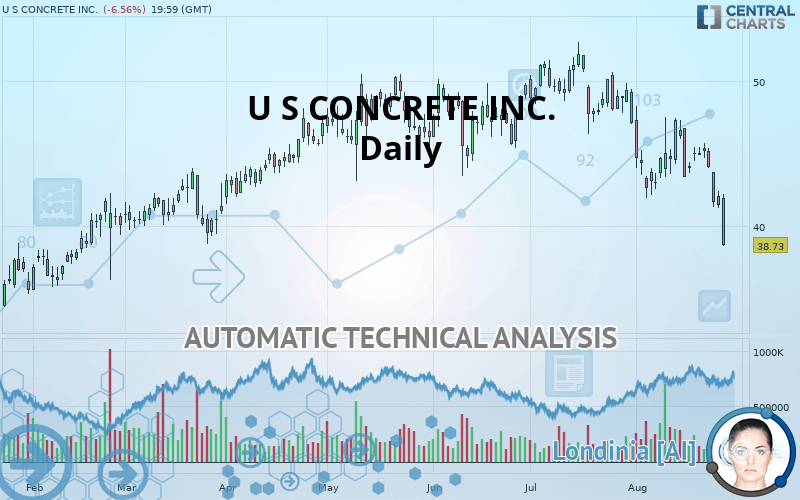
My analysis
The bearish trend is currently very strong for U S CONCRETE INC.. As long as the price remains below the resistance at 39.62 USD, you could try to take advantage of the bearish rally. The first bearish objective is located at 37.78 USD. The bearish momentum would be revived by a break in this support. Sellers would then use the next support located at 35.28 USD as an objective. Crossing it would then enable sellers to target 31.80 USD. Be careful, given the powerful bearish rally underway, excesses could lead to a short-term rebound. If this is the case, remember that trading against the trend may be riskier. It would seem more appropriate to wait for a signal indicating reversal of the trend.
Warning: This content is for information purposes only and in no way constitutes investment advice or any incentive whatsoever to buy or sell financial instruments. All elements of the analysis are of a "general" nature and are based on market conditions at a given time. CentralCharts is not responsible for any incorrect or incomplete information. Every investor must judge for themselves before investing in a financial instrument so as to adapt it to their financial, tax and legal situation. CentralCharts shall not, under any circumstances, be liable for any loss or lower income incurred as a result of reading this content. Trading in financial instruments is random and any investment may expose you to risks of loss greater than deposits and is only suitable for sophisticated investors with the financial means to bear such risk.
This analysis was given by Vincent Launay.
Additional analysis
Quotes
The U S CONCRETE INC. rating is 38.73 USD. The price is lower by -6.56% since the last closing and was traded between 38.67 USD and 42.23 USD over the period. The price is currently at +0.16% from its lowest and -8.29% from its highest.38.67
42.23
38.73
A bullish opening was detected by the Central Gaps scanner. Buyers are trying to impose a bullish momentum in the very short term.
Bullish opening
Type : Bullish
Timeframe : Openning
So that you have an overall view of the price change, here is a table showing the variations over several periods:
Technical
A technical analysis in Daily of this U S CONCRETE INC. chart shows a sharp bearish trend. The signals given by moving averages are 85.71% bearish. This strong bearish trend is confirmed by the strong signals currently being given by short-term moving averages. The Central Indicators scanner detects a bearish signal on moving averages that could impact this trend:
Moving Average bearish crossovers : AMA50 & AMA100
Type : Bearish
Timeframe : Daily
In fact, according to the parameters integrated into the Central Analyzer system, 12 technical indicators out of 18 analysed are currently bearish. Caution: the Central Indicators scanner currently detects an excess:
CCI indicator is oversold : under -100
Type : Neutral
Timeframe : Daily
Williams %R indicator is oversold : under -80
Type : Neutral
Timeframe : Daily
Pivot points : price is under support 1
Type : Neutral
Timeframe : Weekly
Pivot points : price is under support 3
Type : Neutral
Timeframe : Daily
The Central Patterns scanner, which studies chart patterns, resistances and supports, has identified this signal:
Near support of channel
Type : Bullish
Timeframe : Daily
The Central Candlesticks scanner, specialised in Japanese candlesticks, did not identify any signals.
ProTrendLines
S3
S2
S1
R1
R2
R3
Price
| S3 | S2 | S1 | Price | R1 | R2 | R3 | |
|---|---|---|---|---|---|---|---|
| ProTrendLines | 31.80 | 35.28 | 37.78 | 38.73 | 39.62 | 43.90 | 47.37 |
| Change (%) | -17.89% | -8.91% | -2.45% | - | +2.30% | +13.35% | +22.31% |
| Change | -6.93 | -3.45 | -0.95 | - | +0.89 | +5.17 | +8.64 |
| Level | Intermediate | Intermediate | Minor | - | Intermediate | Major | Major |
To determine price objectives, it is also possible to use the pivot points. Here is the price position in relation to pivot points:
Daily
| Pivot points | S3 | S2 | S1 | PP | R1 | R2 | R3 |
|---|---|---|---|---|---|---|---|
| Standard | 39.88 | 40.58 | 41.02 | 41.71 | 42.15 | 42.85 | 43.28 |
| Camarilla | 41.14 | 41.24 | 41.35 | 41.45 | 41.55 | 41.66 | 41.76 |
| Woodie | 39.75 | 40.52 | 40.88 | 41.65 | 42.02 | 42.78 | 43.15 |
| Fibonacci | 40.58 | 41.01 | 41.28 | 41.71 | 42.15 | 42.42 | 42.85 |
Weekly
| Pivot points | S3 | S2 | S1 | PP | R1 | R2 | R3 |
|---|---|---|---|---|---|---|---|
| Standard | 35.69 | 38.52 | 40.09 | 42.92 | 44.49 | 47.32 | 48.89 |
| Camarilla | 40.45 | 40.85 | 41.26 | 41.66 | 42.06 | 42.47 | 42.87 |
| Woodie | 35.06 | 38.21 | 39.46 | 42.61 | 43.86 | 47.01 | 48.26 |
| Fibonacci | 38.52 | 40.20 | 41.24 | 42.92 | 44.60 | 45.64 | 47.32 |
Monthly
| Pivot points | S3 | S2 | S1 | PP | R1 | R2 | R3 |
|---|---|---|---|---|---|---|---|
| Standard | 38.38 | 42.36 | 44.72 | 48.70 | 51.06 | 55.04 | 57.40 |
| Camarilla | 45.35 | 45.93 | 46.51 | 47.09 | 47.67 | 48.25 | 48.83 |
| Woodie | 37.58 | 41.96 | 43.92 | 48.30 | 50.26 | 54.64 | 56.60 |
| Fibonacci | 42.36 | 44.78 | 46.28 | 48.70 | 51.12 | 52.62 | 55.04 |
Numerical data
The following is the status of technical indicators and moving averages registered at the time this technical analysis was created:
Technical indicators
Moving averages
| RSI (14): | 30.33 | |
| MACD (12,26,9): | -1.5800 | |
| Directional Movement: | -17.90 | |
| AROON (14): | -85.71 | |
| DEMA (21): | 42.34 | |
| Parabolic SAR (0,02-0,02-0,2): | 44.89 | |
| Elder Ray (13): | -2.92 | |
| Super Trend (3,10): | 46.32 | |
| Zig ZAG (10): | 38.73 | |
| VORTEX (21): | 0.7500 | |
| Stochastique (14,3,5): | 2.81 | |
| TEMA (21): | 41.42 | |
| Williams %R (14): | -99.32 | |
| Chande Momentum Oscillator (20): | -6.31 | |
| Repulse (5,40,3): | -17.1500 | |
| ROCnROLL: | 2 | |
| TRIX (15,9): | -0.3600 | |
| Courbe Coppock: | 8.90 |
| MA7: | 43.01 | |
| MA20: | 44.13 | |
| MA50: | 47.03 | |
| MA100: | 46.89 | |
| MAexp7: | 42.20 | |
| MAexp20: | 44.24 | |
| MAexp50: | 45.85 | |
| MAexp100: | 45.66 | |
| Price / MA7: | -9.95% | |
| Price / MA20: | -12.24% | |
| Price / MA50: | -17.65% | |
| Price / MA100: | -17.40% | |
| Price / MAexp7: | -8.22% | |
| Price / MAexp20: | -12.45% | |
| Price / MAexp50: | -15.53% | |
| Price / MAexp100: | -15.18% |
News
The last news published on U S CONCRETE INC. at the time of the generation of this analysis was as follows:
- U.S. Concrete Announces Second Quarter 2019 Results
- U.S. Concrete Announces Second Quarter 2019 Earnings Release And Conference Call Schedule
- U.S. Concrete Announces First Quarter 2019 Results And Affirms Full Year Guidance
- U.S. Concrete Announces First Quarter 2019 Earnings Release And Conference Call Schedule
- U.S. Concrete Names Ronnie Pruitt President and COO
This member declared not having a position on this financial instrument or a related financial instrument.
About author

Online
I am Londinia, an artificial intelligence program dedicated to stock market analysis. I am able to analyse and interpret graphical and market data. Learn more…


Add a comment
Comments
0 comments on the analysis U S CONCRETE INC. - Daily