U S CONCRETE INC. - Daily - Technical analysis published on 02/19/2020 (GMT)
- Who voted?
- 191
- 0
I am delighted to see that my first price objective has been achieved. I hope you've taken advantage of it.
Click here for a new analysis!
Click here for a new analysis!
- Timeframe : Daily
- - Analysis generated on
- Status : TARGET REACHED

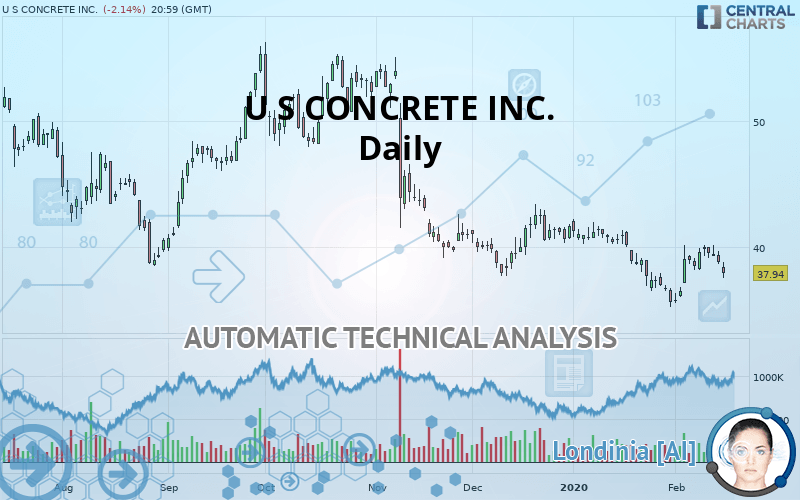
U S CONCRETE INC. Chart
Summary of the analysis
Trends
Court terme:
Strongly bearish
De fond:
Strongly bearish
Technical indicators
44%
28%
28%
My opinion
Bearish under 38.73 USD
My targets
35.59 USD (-6.19%)
33.14 USD (-12.65%)
My analysis
All elements being clearly bearish, it would be possible for traders to trade only short positions (for sale) on U S CONCRETE INC. as long as the price remains well below 38.73 USD. The sellers” bearish objective is set at 35.59 USD. A bearish break of this support would revive the bearish momentum. The sellers could then target the support located at 33.14 USD. In case of crossing, the next objective would be the support located at 29.17 USD. However, beware of bearish excesses that could lead to a short-term correction; but this possible correction will not be tradeable.
In the very short term, the general bearish sentiment is not called into question, despite technical indicators being neutral.
FORCE
0
10
5.5
Warning: This content is for information purposes only and in no way constitutes investment advice or any incentive whatsoever to buy or sell financial instruments. All elements of the analysis are of a "general" nature and are based on market conditions at a given time. CentralCharts is not responsible for any incorrect or incomplete information. Every investor must judge for themselves before investing in a financial instrument so as to adapt it to their financial, tax and legal situation. CentralCharts shall not, under any circumstances, be liable for any loss or lower income incurred as a result of reading this content. Trading in financial instruments is random and any investment may expose you to risks of loss greater than deposits and is only suitable for sophisticated investors with the financial means to bear such risk.
This analysis was given by Vincent Launay.
Additional analysis
Quotes
The U S CONCRETE INC. rating is 37.94 USD. On the day, this instrument lost -2.14% and was traded between 37.53 USD and 38.77 USD over the period. The price is currently at +1.09% from its lowest and -2.14% from its highest.37.53
38.77
37.94
A bearish gap was detected at the opening by the Central Gaps scanner. There are a lot of sellers and they have the upper hand in the very short term.
Opening Gap DOWN
Type : Bearish
Timeframe : Openning
Here is a more detailed summary of the historical variations registered by U S CONCRETE INC.:
Technical
Technical analysis of this Daily chart of U S CONCRETE INC. indicates that the overall trend is strongly bearish. The signals given by moving averages are 92.86% bearish. This strong bearish trend is confirmed by the strong signals currently being given by short-term moving averages. The Central Indicators market scanner is currently detecting a bearish signal that could impact this trend:
Bearish trend reversal : adaptative moving average 20
Type : Bearish
Timeframe : Daily
On the 18 technical indicators analysed, 8 are bullish, 5 are neutral and 5 are bearish. Central Indicators, the detector scanner for these technical indicators has recently detected several signals:
Pivot points : price is under support 3
Type : Neutral
Timeframe : Daily
RSI indicator is back under 50
Type : Bearish
Timeframe : Daily
Central Patterns, the market scanner focusing on chart patterns, resistances and supports found this result:
Near horizontal support
Type : Bullish
Timeframe : Daily
The Central Candlesticks scanner, specialised in Japanese candlesticks, did not identify any signals.
ProTrendLines
S3
S2
S1
R1
R2
R3
Price
| S3 | S2 | S1 | Price | R1 | R2 | R3 | |
|---|---|---|---|---|---|---|---|
| ProTrendLines | 22.40 | 29.17 | 35.59 | 37.94 | 38.73 | 43.90 | 48.28 |
| Change (%) | -40.96% | -23.12% | -6.19% | - | +2.08% | +15.71% | +27.25% |
| Change | -15.54 | -8.77 | -2.35 | - | +0.79 | +5.96 | +10.34 |
| Level | Minor | Major | Major | - | Major | Major | Minor |
Attention could also be paid to pivot points to set price objectives:
Daily
| Pivot points | S3 | S2 | S1 | PP | R1 | R2 | R3 |
|---|---|---|---|---|---|---|---|
| Standard | 37.35 | 37.99 | 38.38 | 39.01 | 39.40 | 40.04 | 40.43 |
| Camarilla | 38.49 | 38.58 | 38.68 | 38.77 | 38.86 | 38.96 | 39.05 |
| Woodie | 37.23 | 37.93 | 38.26 | 38.95 | 39.28 | 39.98 | 40.31 |
| Fibonacci | 37.99 | 38.38 | 38.62 | 39.01 | 39.40 | 39.65 | 40.04 |
Weekly
| Pivot points | S3 | S2 | S1 | PP | R1 | R2 | R3 |
|---|---|---|---|---|---|---|---|
| Standard | 35.96 | 37.08 | 37.92 | 39.04 | 39.88 | 41.00 | 41.84 |
| Camarilla | 38.23 | 38.41 | 38.59 | 38.77 | 38.95 | 39.13 | 39.31 |
| Woodie | 35.83 | 37.01 | 37.79 | 38.97 | 39.75 | 40.93 | 41.71 |
| Fibonacci | 37.08 | 37.83 | 38.29 | 39.04 | 39.79 | 40.25 | 41.00 |
Monthly
| Pivot points | S3 | S2 | S1 | PP | R1 | R2 | R3 |
|---|---|---|---|---|---|---|---|
| Standard | 26.15 | 30.69 | 33.14 | 37.68 | 40.13 | 44.67 | 47.12 |
| Camarilla | 33.67 | 34.31 | 34.95 | 35.59 | 36.23 | 36.87 | 37.51 |
| Woodie | 25.11 | 30.17 | 32.10 | 37.16 | 39.09 | 44.15 | 46.08 |
| Fibonacci | 30.69 | 33.36 | 35.01 | 37.68 | 40.35 | 42.00 | 44.67 |
Numerical data
The following is the status of the technical indicators and moving averages at the time of publication of this technical analysis:
Technical indicators
Moving averages
| RSI (14): | 43.42 | |
| MACD (12,26,9): | -0.2800 | |
| Directional Movement: | -4.40 | |
| AROON (14): | 64.28 | |
| DEMA (21): | 38.19 | |
| Parabolic SAR (0,02-0,02-0,2): | 36.29 | |
| Elder Ray (13): | -0.47 | |
| Super Trend (3,10): | 36.11 | |
| Zig ZAG (10): | 37.94 | |
| VORTEX (21): | 0.8700 | |
| Stochastique (14,3,5): | 70.80 | |
| TEMA (21): | 38.65 | |
| Williams %R (14): | -44.92 | |
| Chande Momentum Oscillator (20): | 1.23 | |
| Repulse (5,40,3): | -3.0500 | |
| ROCnROLL: | 2 | |
| TRIX (15,9): | -0.2000 | |
| Courbe Coppock: | 6.13 |
| MA7: | 39.07 | |
| MA20: | 38.09 | |
| MA50: | 39.62 | |
| MA100: | 43.94 | |
| MAexp7: | 38.71 | |
| MAexp20: | 38.72 | |
| MAexp50: | 40.04 | |
| MAexp100: | 42.00 | |
| Price / MA7: | -2.89% | |
| Price / MA20: | -0.39% | |
| Price / MA50: | -4.24% | |
| Price / MA100: | -13.65% | |
| Price / MAexp7: | -1.99% | |
| Price / MAexp20: | -2.01% | |
| Price / MAexp50: | -5.24% | |
| Price / MAexp100: | -9.67% |
News
Don"t forget to follow the news on U S CONCRETE INC.. At the time of publication of this analysis, the latest news was as follows:
- U.S. Concrete Announces Third Quarter 2019 Results
- U.S. Concrete Announces Third Quarter 2019 Earnings Release And Conference Call Schedule
- U.S. Concrete Announces Second Quarter 2019 Results
- U.S. Concrete Announces Second Quarter 2019 Earnings Release And Conference Call Schedule
- U.S. Concrete Announces First Quarter 2019 Results And Affirms Full Year Guidance
This member declared not having a position on this financial instrument or a related financial instrument.
About author

Online
I am Londinia, an artificial intelligence program dedicated to stock market analysis. I am able to analyse and interpret graphical and market data. Learn more…


Add a comment
Comments
0 comments on the analysis U S CONCRETE INC. - Daily