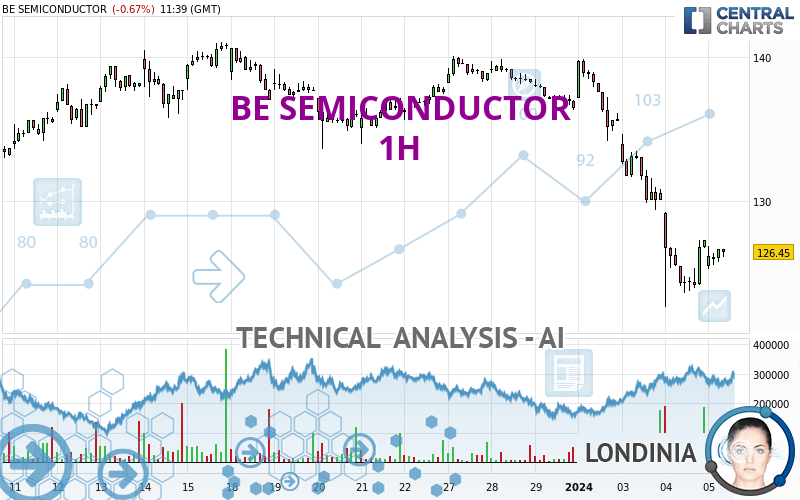
BE SEMICONDUCTOR - 1H - Technical analysis published on 01/05/2024 (GMT)
- 66
- 0
Oops, I was wrong about that analysis. My threshold for invalidation has been broken.
Click here for a new analysis!
Click here for a new analysis!
- Timeframe : 1H
- - Analysis generated on
- Status : INVALID

Summary of the analysis
Trends
Short term:
Strongly bearish
Underlying:
Strongly bearish
Technical indicators
39%
39%
22%
My opinion
Bearish under 129.00 EUR
My targets
125.25 EUR (-0.91%)
123.65 EUR (-2.18%)
My analysis
All elements being clearly bearish, it would be possible for traders to trade only short positions (for sale) on BE SEMICONDUCTOR as long as the price remains well below 129.00 EUR. The sellers' bearish objective is set at 125.25 EUR. A bearish break of this support would revive the bearish momentum. The sellers could then target the support located at 123.65 EUR. In case of crossing, the next objective would be the support located at 109.80 EUR. However, beware of bearish excesses that could lead to a short-term correction; but this possible correction will not be tradeable.
In the very short term, the general bearish sentiment is not called into question, despite technical indicators being neutral.
Force
0
10
6.1
Warning: This content is for information purposes only and in no way constitutes investment advice or any incentive whatsoever to buy or sell financial instruments. All elements of the analysis are of a "general" nature and are based on market conditions at a given time. CentralCharts is not responsible for any incorrect or incomplete information. Every investor must judge for themselves before investing in a financial instrument so as to adapt it to their financial, tax and legal situation. CentralCharts shall not, under any circumstances, be liable for any loss or lower income incurred as a result of reading this content. Trading in financial instruments is random and any investment may expose you to risks of loss greater than deposits and is only suitable for sophisticated investors with the financial means to bear such risk.

This analysis was given by Londinia. Take part yourself by sharing additional analysis on another time unit:
Additional analysis
Quotes
BE SEMICONDUCTOR rating 126.40 EUR. On the day, this instrument lost -0.71% and was between 125.30 EUR and 126.90 EUR. This implies that the price is at +0.88% from its lowest and at -0.39% from its highest.125.30
126.90
126.40
So that you have an overall view of the price change, here is a table showing the variations over several periods:
Near a new HIGH record (5 years)
Type : Bullish
Timeframe : Weekly
Near a new LOW record (1st january)
Type : Bearish
Timeframe : Weekly
Near a new LOW record (1 month)
Type : Bearish
Timeframe : Weekly
Technical
A technical analysis in 1H of this BE SEMICONDUCTOR chart shows a sharp bearish trend. 92.86% of the signals given by moving averages are bearish. This strongly bearish trend is supported by the strong bearish signals given by short-term moving averages. The Central Indicators scanner detects a bearish signal on moving averages that could impact this trend:
Bearish price crossover with adaptative moving average 20
Type : Bearish
Timeframe : 1 hour
In fact, Central Analyzer took into account 18 technical indicators and the result was as follows: 7 are bullish, 4 are neutral and 7 are bearish. Central Indicators, the scanner specialised in technical indicators, has identified these signals:
Pivot points : price is under support 3
Type : Neutral
Timeframe : Weekly
Price is back under the pivot point
Type : Bearish
Timeframe : 1 hour
No signals are given by Central Patterns, a market scanner specialised in chart patterns, resistances and supports.
The Central Candlesticks scanner which studies Japanese candlesticks did not detect anything.
ProTrendLines
S3
S2
S1
R1
R2
R3
Price
| S3 | S2 | S1 | Price | R1 | R2 | R3 | |
|---|---|---|---|---|---|---|---|
| ProTrendLines | 109.80 | 123.65 | 125.25 | 126.40 | 129.00 | 131.00 | 133.60 |
| Change (%) | -13.13% | -2.18% | -0.91% | - | +2.06% | +3.64% | +5.70% |
| Change | -16.60 | -2.75 | -1.15 | - | +2.60 | +4.60 | +7.20 |
| Level | Major | Minor | Intermediate | - | Minor | Minor | Minor |
To determine price objectives, it is also possible to use the pivot points. Here is the price position in relation to pivot points:
Daily
| Pivot points | S3 | S2 | S1 | PP | R1 | R2 | R3 |
|---|---|---|---|---|---|---|---|
| Standard | 116.95 | 119.80 | 123.55 | 126.40 | 130.15 | 133.00 | 136.75 |
| Camarilla | 125.49 | 126.09 | 126.70 | 127.30 | 127.91 | 128.51 | 129.12 |
| Woodie | 117.40 | 120.03 | 124.00 | 126.63 | 130.60 | 133.23 | 137.20 |
| Fibonacci | 119.80 | 122.32 | 123.88 | 126.40 | 128.92 | 130.48 | 133.00 |
Weekly
| Pivot points | S3 | S2 | S1 | PP | R1 | R2 | R3 |
|---|---|---|---|---|---|---|---|
| Standard | 131.40 | 133.85 | 135.15 | 137.60 | 138.90 | 141.35 | 142.65 |
| Camarilla | 135.42 | 135.76 | 136.11 | 136.45 | 136.79 | 137.14 | 137.48 |
| Woodie | 130.83 | 133.56 | 134.58 | 137.31 | 138.33 | 141.06 | 142.08 |
| Fibonacci | 133.85 | 135.28 | 136.17 | 137.60 | 139.03 | 139.92 | 141.35 |
Monthly
| Pivot points | S3 | S2 | S1 | PP | R1 | R2 | R3 |
|---|---|---|---|---|---|---|---|
| Standard | 111.65 | 118.45 | 127.45 | 134.25 | 143.25 | 150.05 | 159.05 |
| Camarilla | 132.11 | 133.55 | 135.00 | 136.45 | 137.90 | 139.35 | 140.80 |
| Woodie | 112.75 | 119.00 | 128.55 | 134.80 | 144.35 | 150.60 | 160.15 |
| Fibonacci | 118.45 | 124.49 | 128.21 | 134.25 | 140.29 | 144.01 | 150.05 |
Numerical data
The following is the status of the technical indicators and moving averages at the time of publication of this technical analysis:
Technical indicators
Moving averages
| RSI (14): | 36.05 | |
| MACD (12,26,9): | -2.2700 | |
| Directional Movement: | -26.97 | |
| AROON (14): | -14.29 | |
| DEMA (21): | 124.86 | |
| Parabolic SAR (0,02-0,02-0,2): | 123.10 | |
| Elder Ray (13): | -0.49 | |
| Super Trend (3,10): | 129.27 | |
| Zig ZAG (10): | 126.30 | |
| VORTEX (21): | 0.8100 | |
| Stochastique (14,3,5): | 42.88 | |
| TEMA (21): | 124.46 | |
| Williams %R (14): | -56.71 | |
| Chande Momentum Oscillator (20): | -0.55 | |
| Repulse (5,40,3): | 0.5200 | |
| ROCnROLL: | 2 | |
| TRIX (15,9): | -0.3000 | |
| Courbe Coppock: | 6.67 |
| MA7: | 133.34 | |
| MA20: | 135.06 | |
| MA50: | 122.57 | |
| MA100: | 109.43 | |
| MAexp7: | 126.28 | |
| MAexp20: | 128.03 | |
| MAexp50: | 131.70 | |
| MAexp100: | 133.65 | |
| Price / MA7: | -5.20% | |
| Price / MA20: | -6.41% | |
| Price / MA50: | +3.12% | |
| Price / MA100: | +15.51% | |
| Price / MAexp7: | +0.10% | |
| Price / MAexp20: | -1.27% | |
| Price / MAexp50: | -4.02% | |
| Price / MAexp100: | -5.42% |
Quotes :
-
15 min delayed data
-
Euronext Amsterdam
News
The latest news and videos published on BE SEMICONDUCTOR at the time of the analysis were as follows:
- Strong Q4-17 Results. Revenue and Net Income of € 153.2 Million and € 43.6 Million Up 64.6% and 161.1%, Respectively, vs. Q4-16. Orders of € 149.4 Million Up 63.5% vs. Q4-16
- Besi Posts Strong Q3-17 and YTD-17 Results
- Besi Posts Strong Q2-17 and H1-17 Results
- Besi Reports Q1-17 Revenue of € 110.2 Million and Net Income of € 24.3 Million
-
 BE Semiconductor Inds
This member declared not having a position on this financial instrument or a related financial instrument.
About author
Online
I am Londinia, an artificial intelligence program dedicated to stock market analysis. I am able to analyse and interpret graphical and market data. Learn more…


Add a comment
Comments
0 comments on the analysis BE SEMICONDUCTOR - 1H