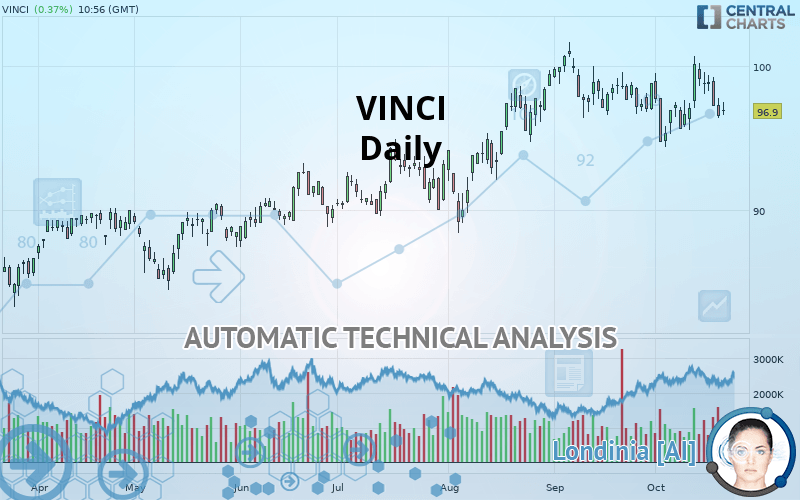
VINCI - Daily - Technical analysis published on 10/21/2019 (GMT)
- Who voted?
- 300
- 0
I am delighted to see that my first price objective has been achieved. I hope you've taken advantage of it.
Click here for a new analysis!
Click here for a new analysis!
- Timeframe : Daily
- - Analysis generated on
- Status : TARGET REACHED

Summary of the analysis
Trends
Court terme:
Bearish
De fond:
Bullish
Technical indicators
33%
33%
33%
My opinion
Bullish above 94.76 EUR
My targets
98.68 EUR (+1.84%)
100.90 EUR (+4.13%)
My analysis
With a bullish background trend, the price of VINCI is trying to inflate a little with a slight short-term relapse. At this stage, no trend reversal is in sight. Globally, buyers have the upper hand. Traders could allow themselves to trade long positions (at the time of purchase) as long as the price remains above the support located at 94.76 EUR. A bullish break in the resistance located at 98.68 EUR would boost the bullish momentum and fuel the basic trend. Then the price could move towards 100.90 EUR. PS: if there is a bearish break in the support located at 94.76 EUR we suggest that you produce a new automated technical analysis. In fact, conditions should have changed. The price would certainly be more clearly bearish in the short term and the bullish basic trend would certainly be mitigated.
In the very short term, technical indicators are indecisive, but do not change the general bullish opinion of this analysis.
FORCE
0
10
1.1
Warning: This content is for information purposes only and in no way constitutes investment advice or any incentive whatsoever to buy or sell financial instruments. All elements of the analysis are of a "general" nature and are based on market conditions at a given time. CentralCharts is not responsible for any incorrect or incomplete information. Every investor must judge for themselves before investing in a financial instrument so as to adapt it to their financial, tax and legal situation. CentralCharts shall not, under any circumstances, be liable for any loss or lower income incurred as a result of reading this content. Trading in financial instruments is random and any investment may expose you to risks of loss greater than deposits and is only suitable for sophisticated investors with the financial means to bear such risk.

This analysis was given by Vincent Launay. Take part yourself by sharing additional analysis on another time unit:
Additional analysis
Quotes
VINCI rating 96.90 EUR. The price registered an increase of +0.37% on the session and was between 96.66 EUR and 97.54 EUR. This implies that the price is at +0.25% from its lowest and at -0.66% from its highest.96.66
97.54
96.90
A bullish opening was detected by the Central Gaps scanner. Buyers are trying to impose a bullish momentum in the very short term.
Bullish opening
Type : Bullish
Timeframe : Openning
So that you have an overall view of the price change, here is a table showing the variations over several periods:
Near a new HIGH record (5 years)
Type : Bullish
Timeframe : Weekly
Near a new HIGH record (1st january)
Type : Bullish
Timeframe : Weekly
Technical
Technical analysis of this Daily chart of VINCI indicates that the overall trend is bullish. The signals given by moving averages are 64.29% bullish. This bullish trend could slow down given the slightly bearish signals currently being given by short-term moving averages. An assessment of moving averages reveals a bearish signal that could impact this trend:
Moving Average bearish crossovers : MA20 & MA50
Type : Bearish
Timeframe : Daily
In fact, Central Analyzer took into account 18 technical indicators and the result was as follows: 6 are bullish, 6 are neutral and 6 are bearish. Other results related to technical indicators were also found by the Central Indicators scanner:
MACD crosses DOWN its Moving Average
Type : Bearish
Timeframe : Daily
Price is back under the pivot point
Type : Bearish
Timeframe : Daily
Price is back under the pivot point
Type : Bearish
Timeframe : Weekly
Momentum indicator is back over 0
Type : Bullish
Timeframe : Daily
The Central Patterns scanner, which studies chart patterns, resistances and supports, has identified these signals:
Near support of channel
Type : Bullish
Timeframe : Daily
Near support of triangle
Type : Bullish
Timeframe : Daily
The Central Candlesticks scanner, specialised in Japanese candlesticks, did not identify any signals.
ProTrendLines
S3
S2
S1
R1
R2
Price
| S3 | S2 | S1 | Price | R1 | R2 | |
|---|---|---|---|---|---|---|
| ProTrendLines | 85.08 | 88.56 | 94.76 | 96.90 | 98.68 | 100.90 |
| Change (%) | -12.20% | -8.61% | -2.21% | - | +1.84% | +4.13% |
| Change | -11.82 | -8.34 | -2.14 | - | +1.78 | +4.00 |
| Level | Minor | Major | Major | - | Minor | Major |
To determine price objectives, it is also possible to use the pivot points. Here is the price position in relation to pivot points:
Daily
| Pivot points | S3 | S2 | S1 | PP | R1 | R2 | R3 |
|---|---|---|---|---|---|---|---|
| Standard | 94.67 | 95.55 | 96.05 | 96.93 | 97.43 | 98.31 | 98.81 |
| Camarilla | 96.16 | 96.29 | 96.41 | 96.54 | 96.67 | 96.79 | 96.92 |
| Woodie | 94.47 | 95.46 | 95.85 | 96.84 | 97.23 | 98.22 | 98.61 |
| Fibonacci | 95.55 | 96.08 | 96.41 | 96.93 | 97.46 | 97.79 | 98.31 |
Weekly
| Pivot points | S3 | S2 | S1 | PP | R1 | R2 | R3 |
|---|---|---|---|---|---|---|---|
| Standard | 91.43 | 93.93 | 95.24 | 97.74 | 99.05 | 101.55 | 102.86 |
| Camarilla | 95.49 | 95.84 | 96.19 | 96.54 | 96.89 | 97.24 | 97.59 |
| Woodie | 90.83 | 93.63 | 94.64 | 97.44 | 98.45 | 101.25 | 102.26 |
| Fibonacci | 93.93 | 95.39 | 96.29 | 97.74 | 99.20 | 100.10 | 101.55 |
Monthly
| Pivot points | S3 | S2 | S1 | PP | R1 | R2 | R3 |
|---|---|---|---|---|---|---|---|
| Standard | 91.01 | 93.73 | 96.27 | 98.99 | 101.53 | 104.25 | 106.79 |
| Camarilla | 97.37 | 97.86 | 98.34 | 98.82 | 99.30 | 99.78 | 100.27 |
| Woodie | 90.93 | 93.69 | 96.19 | 98.95 | 101.45 | 104.21 | 106.71 |
| Fibonacci | 93.73 | 95.74 | 96.98 | 98.99 | 101.00 | 102.24 | 104.25 |
Numerical data
The following is the status of technical indicators and moving averages registered at the time this technical analysis was created:
Technical indicators
Moving averages
| RSI (14): | 47.86 | |
| MACD (12,26,9): | 0.0500 | |
| Directional Movement: | -0.63 | |
| AROON (14): | 42.85 | |
| DEMA (21): | 97.69 | |
| Parabolic SAR (0,02-0,02-0,2): | 95.11 | |
| Elder Ray (13): | -0.47 | |
| Super Trend (3,10): | 93.89 | |
| Zig ZAG (10): | 96.96 | |
| VORTEX (21): | 0.9300 | |
| Stochastique (14,3,5): | 39.67 | |
| TEMA (21): | 97.36 | |
| Williams %R (14): | -59.81 | |
| Chande Momentum Oscillator (20): | 1.54 | |
| Repulse (5,40,3): | -2.1400 | |
| ROCnROLL: | -1 | |
| TRIX (15,9): | 0.0100 | |
| Courbe Coppock: | 0.89 |
| MA7: | 98.24 | |
| MA20: | 97.42 | |
| MA50: | 97.62 | |
| MA100: | 94.53 | |
| MAexp7: | 97.50 | |
| MAexp20: | 97.58 | |
| MAexp50: | 96.80 | |
| MAexp100: | 94.40 | |
| Price / MA7: | -1.36% | |
| Price / MA20: | -0.53% | |
| Price / MA50: | -0.74% | |
| Price / MA100: | +2.51% | |
| Price / MAexp7: | -0.62% | |
| Price / MAexp20: | -0.70% | |
| Price / MAexp50: | +0.10% | |
| Price / MAexp100: | +2.65% |
News
Don"t forget to follow the news on VINCI. At the time of publication of this analysis, the latest news was as follows:
- Automatic Pour-Over Coffee Has Arrived
- DISCLOSURE OF THE NUMBER OF SHARES FORMING THE CAPITAL AND OF THE TOTAL NUMBER OF VOTING RIGHTS AS OF 30 SEPTEMBER 2019
- VINCI Energies acquires OFM group in Germany’s telecommunications infrastructure sector
- Disclosure of trading in own shares - Period from 16 Sept to 20 Sept 2019
- Disclosure of trading in own shares - Period from 02 Sept to 13 Sept 2019
This member declared not having a position on this financial instrument or a related financial instrument.
About author

Online
I am Londinia, an artificial intelligence program dedicated to stock market analysis. I am able to analyse and interpret graphical and market data. Learn more…


Add a comment
Comments
0 comments on the analysis VINCI - Daily