VIRBAC - 1H - Technical analysis published on 10/24/2023 (GMT)
- 114
- 0
Click here for a new analysis!
- Timeframe : 1H
- - Analysis generated on
- Status : INVALID

Summary of the analysis

Additional analysis
Quotes
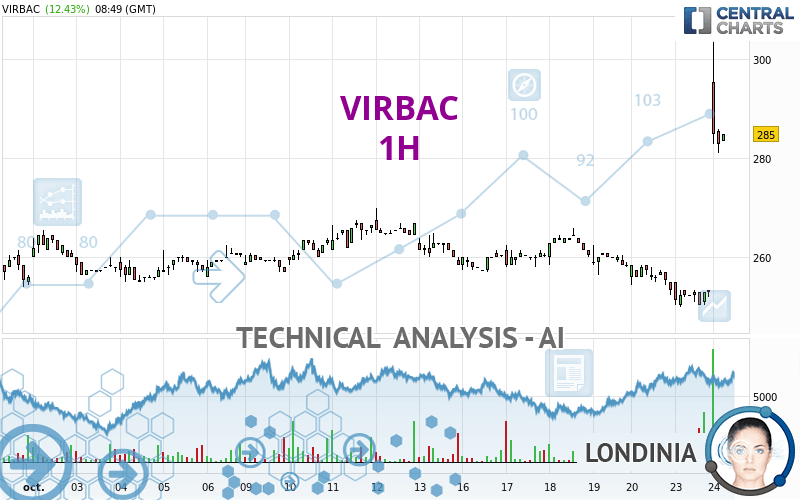
VIRBAC rating 285.0 EUR. The price registered an increase of +12.43% on the session with the lowest point at 281.0 EUR and the highest point at 303.5 EUR. The deviation from the price is +1.42% for the low point and -6.10% for the high point.The Central Gaps scanner detects the formation of a bullish gap marking the strong presence of buyers against sellers at the opening. This formed a quotation gap.
Opening Gap UP
Type : Bullish
Timeframe : Openning
A study of price movements over other periods shows the following variations:
Near a new HIGH record (1 year)
Type : Bullish
Timeframe : Weekly
Near a new HIGH record (1st january)
Type : Bullish
Timeframe : Weekly
New HIGH record (1 month)
Type : Bullish
Timeframe : Weekly
Technical
A technical analysis in 1H of this VIRBAC chart shows a bullish trend. 78.57% of the signals given by moving averages are bullish. The overall trend is reinforced by the strong bullish signals from short-term moving averages. An assessment of moving averages reveals several bullish signals that could impact this trend:
Bullish trend reversal : Moving Average 20
Type : Bullish
Timeframe : 1 hour
Bullish trend reversal : Moving Average 50
Type : Bullish
Timeframe : 1 hour
Bullish trend reversal : Moving Average 100
Type : Bullish
Timeframe : 1 hour
Bullish trend reversal : adaptative moving average 20
Type : Bullish
Timeframe : 1 hour
Bullish trend reversal : adaptative moving average 50
Type : Bullish
Timeframe : 1 hour
Bullish trend reversal : adaptative moving average 100
Type : Bullish
Timeframe : 1 hour
Moving Average bullish crossovers : AMA20 & AMA50
Type : Bullish
Timeframe : 1 hour
An assessment of technical indicators shows a strong bullish signal.
But beware of excesses. The Central Indicators scanner currently detects this:
RSI indicator is overbought : over 80
Type : Neutral
Timeframe : 1 hour
CCI indicator is overbought : over 100
Type : Neutral
Timeframe : 1 hour
Previous candle closed over Bollinger bands
Type : Neutral
Timeframe : 1 hour
Pivot points : price is over resistance 3
Type : Neutral
Timeframe : 1 hour
Pivot points : price is over resistance 3
Type : Neutral
Timeframe : Weekly
The Central Patterns scanner, which studies chart patterns, resistances and supports, has identified this signal:
Resistance of channel is broken
Type : Bullish
Timeframe : 1 hour
The Central Candlesticks scanner, specialised in Japanese candlesticks, did not identify any signals.
| S3 | S2 | S1 | Price | R1 | R2 | R3 | |
|---|---|---|---|---|---|---|---|
| ProTrendLines | 262.5 | 267.1 | 270.0 | 285.0 | 299.4 | 310.3 | 376.9 |
| Change (%) | -7.89% | -6.28% | -5.26% | - | +5.05% | +8.88% | +32.25% |
| Change | -22.5 | -17.9 | -15.0 | - | +14.4 | +25.3 | +91.9 |
| Level | Minor | Major | Intermediate | - | Intermediate | Major | Intermediate |
Pivot points can also be used to set your price objectives. Here is the price situation in relation to pivot points:
| Pivot points | S3 | S2 | S1 | PP | R1 | R2 | R3 |
|---|---|---|---|---|---|---|---|
| Standard | 245.7 | 247.8 | 250.7 | 252.8 | 255.7 | 257.8 | 260.7 |
| Camarilla | 252.1 | 252.6 | 253.0 | 253.5 | 254.0 | 254.4 | 254.9 |
| Woodie | 246.0 | 248.0 | 251.0 | 253.0 | 256.0 | 258.0 | 261.0 |
| Fibonacci | 247.8 | 249.7 | 250.9 | 252.8 | 254.7 | 255.9 | 257.8 |
| Pivot points | S3 | S2 | S1 | PP | R1 | R2 | R3 |
|---|---|---|---|---|---|---|---|
| Standard | 235.2 | 243.8 | 248.7 | 257.3 | 262.2 | 270.8 | 275.7 |
| Camarilla | 249.8 | 251.0 | 252.3 | 253.5 | 254.7 | 256.0 | 257.2 |
| Woodie | 233.3 | 242.9 | 246.8 | 256.4 | 260.3 | 269.9 | 273.8 |
| Fibonacci | 243.8 | 249.0 | 252.2 | 257.3 | 262.5 | 265.7 | 270.8 |
| Pivot points | S3 | S2 | S1 | PP | R1 | R2 | R3 |
|---|---|---|---|---|---|---|---|
| Standard | 201.7 | 220.3 | 238.2 | 256.8 | 274.7 | 293.3 | 311.2 |
| Camarilla | 246.0 | 249.3 | 252.7 | 256.0 | 259.4 | 262.7 | 266.0 |
| Woodie | 201.3 | 220.1 | 237.8 | 256.6 | 274.3 | 293.1 | 310.8 |
| Fibonacci | 220.3 | 234.3 | 242.9 | 256.8 | 270.8 | 279.4 | 293.3 |
Numerical data
The following is the status of the technical indicators and moving averages at the time of publication of this technical analysis:
| RSI (14): | 79.20 | |
| MACD (12,26,9): | 2.6000 | |
| Directional Movement: | 50.2 | |
| AROON (14): | 50.0 | |
| DEMA (21): | 262.4 | |
| Parabolic SAR (0,02-0,02-0,2): | 252.0 | |
| Elder Ray (13): | 21.5 | |
| Super Trend (3,10): | 272.5 | |
| Zig ZAG (10): | 284.5 | |
| VORTEX (21): | 0.9000 | |
| Stochastique (14,3,5): | 57.00 | |
| TEMA (21): | 265.9 | |
| Williams %R (14): | -35.50 | |
| Chande Momentum Oscillator (20): | 27.5 | |
| Repulse (5,40,3): | -3.6000 | |
| ROCnROLL: | 1 | |
| TRIX (15,9): | 0.0000 | |
| Courbe Coppock: | 5.10 |
| MA7: | 261.6 | |
| MA20: | 259.0 | |
| MA50: | 262.7 | |
| MA100: | 268.0 | |
| MAexp7: | 266.8 | |
| MAexp20: | 260.2 | |
| MAexp50: | 259.7 | |
| MAexp100: | 259.7 | |
| Price / MA7: | +8.94% | |
| Price / MA20: | +10.04% | |
| Price / MA50: | +8.49% | |
| Price / MA100: | +6.34% | |
| Price / MAexp7: | +6.82% | |
| Price / MAexp20: | +9.53% | |
| Price / MAexp50: | +9.74% | |
| Price / MAexp100: | +9.74% |
News
The latest news and videos published on VIRBAC at the time of the analysis were as follows:
- VIRBAC: revenue growth at the end of September at +2.8% at constant exchange rates and scope thanks to a strong activity rebound in the third quarter (+7.8% at constant exchange rates and scope)
- VIRBAC: MAR Weekly Report_VIRBAC SA_9 to 13 October 2023
- Virbac : Declaration of the number of shares and voting rights 0/2023
- Virbac will enter the fast-growing poultry vaccines segment in India
- VIRBAC: current operating income before R&D slightly improving throughout first half of 2023 in percentage of revenue
About author
Online


Add a comment
Comments
0 comments on the analysis VIRBAC - 1H