GOLD - USD - 15 min. - Technical analysis published on 04/12/2024 (GMT)
- 72
- 0
Click here for a new analysis!
- Timeframe : 15 min.
- - Analysis generated on
- Status : INVALID
Summary of the analysis

Additional analysis
Quotes
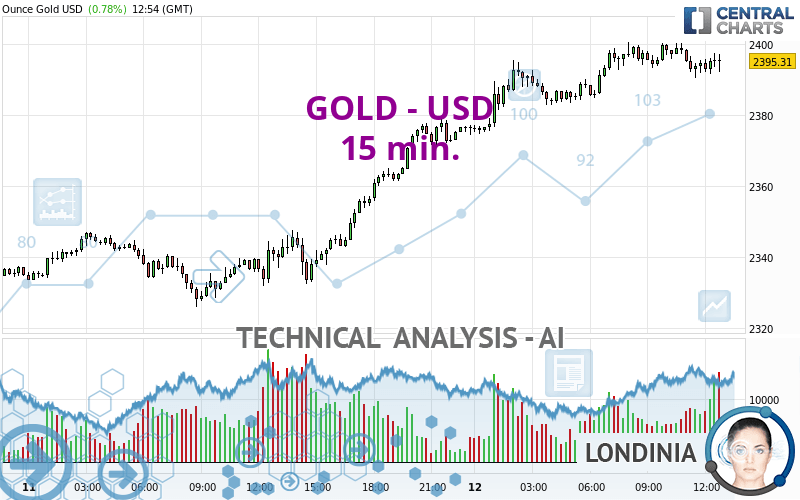
GOLD - USD rating 2,395.40 USD. The price has increased by +0.78% since the last closing and was traded between 2,374.63 USD and 2,400.68 USD over the period. The price is currently at +0.87% from its lowest and -0.22% from its highest.A bullish opening was detected by the Central Gaps scanner. Buyers are trying to impose a bullish momentum in the very short term.
Bullish opening
Type : Bullish
Timeframe : Openning
So that you have an overall view of the price change, here is a table showing the variations over several periods:
New HIGH record (5 years)
Type : Bullish
Timeframe : Weekly
New HIGH record (1 year)
Type : Bullish
Timeframe : Weekly
New HIGH record (1st january)
Type : Bullish
Timeframe : Weekly
New HIGH record (1 month)
Type : Bullish
Timeframe : Weekly
Technical
A technical analysis in 15 min. of this GOLD - USD chart shows a strongly bullish trend. 85.71% of the signals given by moving averages are bullish. The slightly bullish signals given by the short-term moving averages show a weakening of the global trend. The Central Indicators scanner detects a bullish signal on moving averages that could impact this trend:
Bullish price crossover with Moving Average 20
Type : Bullish
Timeframe : 15 minutes
The technical indicators are generally neutral. They do not provide relevant information on the direction of future price movements.
Caution: the Central Indicators scanner currently detects an excess:
Williams %R indicator is oversold : under -80
Type : Neutral
Timeframe : 15 minutes
Pivot points : price is over resistance 1
Type : Neutral
Timeframe : 15 minutes
Pivot points : price is over resistance 2
Type : Neutral
Timeframe : Weekly
Momentum indicator is back under 0
Type : Bearish
Timeframe : 15 minutes
The analysis of the price chart with Central Patterns scanners does not return any result.
For a small setback in the very short term, the Central Candlesticks scanner currently notes the presence of this bearish pattern in Japanese candlesticks:
Bearish harami
Type : Bearish
Timeframe : 15 minutes
Bearish harami cross
Type : Bearish
Timeframe : 15 minutes
| S3 | S2 | S1 | Price | |
|---|---|---|---|---|
| ProTrendLines | 2,288.35 | 2,319.21 | 2,347.13 | 2,395.40 |
| Change (%) | -4.47% | -3.18% | -2.02% | - |
| Change | -107.05 | -76.19 | -48.27 | - |
| Level | Minor | Intermediate | Intermediate | - |
Attention could also be paid to pivot points to set price objectives:
| Pivot points | S3 | S2 | S1 | PP | R1 | R2 | R3 |
|---|---|---|---|---|---|---|---|
| Standard | 2,288.16 | 2,307.00 | 2,341.93 | 2,360.77 | 2,395.70 | 2,414.54 | 2,449.47 |
| Camarilla | 2,362.08 | 2,367.01 | 2,371.94 | 2,376.87 | 2,381.80 | 2,386.73 | 2,391.66 |
| Woodie | 2,296.22 | 2,311.02 | 2,349.99 | 2,364.79 | 2,403.76 | 2,418.56 | 2,457.53 |
| Fibonacci | 2,307.00 | 2,327.54 | 2,340.23 | 2,360.77 | 2,381.31 | 2,394.00 | 2,414.54 |
| Pivot points | S3 | S2 | S1 | PP | R1 | R2 | R3 |
|---|---|---|---|---|---|---|---|
| Standard | 2,156.81 | 2,192.67 | 2,258.76 | 2,294.62 | 2,360.71 | 2,396.57 | 2,462.66 |
| Camarilla | 2,296.82 | 2,306.17 | 2,315.52 | 2,324.86 | 2,334.21 | 2,343.55 | 2,352.90 |
| Woodie | 2,171.94 | 2,200.23 | 2,273.89 | 2,302.18 | 2,375.84 | 2,404.13 | 2,477.79 |
| Fibonacci | 2,192.67 | 2,231.61 | 2,255.67 | 2,294.62 | 2,333.56 | 2,357.62 | 2,396.57 |
| Pivot points | S3 | S2 | S1 | PP | R1 | R2 | R3 |
|---|---|---|---|---|---|---|---|
| Standard | 1,905.68 | 1,972.37 | 2,103.03 | 2,169.72 | 2,300.38 | 2,367.07 | 2,497.73 |
| Camarilla | 2,179.41 | 2,197.50 | 2,215.59 | 2,233.68 | 2,251.77 | 2,269.86 | 2,287.95 |
| Woodie | 1,937.66 | 1,988.36 | 2,135.01 | 2,185.71 | 2,332.36 | 2,383.06 | 2,529.71 |
| Fibonacci | 1,972.37 | 2,047.76 | 2,094.34 | 2,169.72 | 2,245.11 | 2,291.69 | 2,367.07 |
Numerical data
The following is the status of the technical indicators and moving averages at the time of publication of this technical analysis:
| RSI (14): | 53.89 | |
| MACD (12,26,9): | 1.3200 | |
| Directional Movement: | -1.37 | |
| AROON (14): | -28.57 | |
| DEMA (21): | 2,397.47 | |
| Parabolic SAR (0,02-0,02-0,2): | 2,398.81 | |
| Elder Ray (13): | -0.03 | |
| Super Trend (3,10): | 2,389.15 | |
| Zig ZAG (10): | 2,395.71 | |
| VORTEX (21): | 0.9800 | |
| Stochastique (14,3,5): | 47.39 | |
| TEMA (21): | 2,395.47 | |
| Williams %R (14): | -40.18 | |
| Chande Momentum Oscillator (20): | 0.41 | |
| Repulse (5,40,3): | 0.1600 | |
| ROCnROLL: | 1 | |
| TRIX (15,9): | 0.0100 | |
| Courbe Coppock: | 0.09 |
| MA7: | 2,344.81 | |
| MA20: | 2,252.40 | |
| MA50: | 2,140.43 | |
| MA100: | 2,086.49 | |
| MAexp7: | 2,395.05 | |
| MAexp20: | 2,395.16 | |
| MAexp50: | 2,388.93 | |
| MAexp100: | 2,377.69 | |
| Price / MA7: | +2.16% | |
| Price / MA20: | +6.35% | |
| Price / MA50: | +11.91% | |
| Price / MA100: | +14.81% | |
| Price / MAexp7: | +0.01% | |
| Price / MAexp20: | +0.01% | |
| Price / MAexp50: | +0.27% | |
| Price / MAexp100: | +0.74% |
News
Don't forget to follow the news on GOLD - USD. At the time of publication of this analysis, the latest news was as follows:
-
 Fun Fact Friday: Enough #gold to coat the Earth?
-
Gold Daily Forecast and Technical Analysis for April 11, 2024 by Bruce Powers, CMT, FX Empire
-
Gold Daily Forecast and Technical Analysis for April 11, by Chris Lewis, #XAUUSD, #FXEmpire #gold
-
Gold Daily Forecast and Technical Analysis for April 11, 2024, by Chris Lewis for FX Empire
-
Gold Daily Forecast and Technical Analysis for April 11, by Bruce Powers, #CMT, #FXEmpire #gold
About author

Online


Add a comment
Comments
0 comments on the analysis GOLD - USD - 15 min.