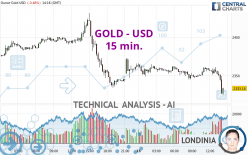
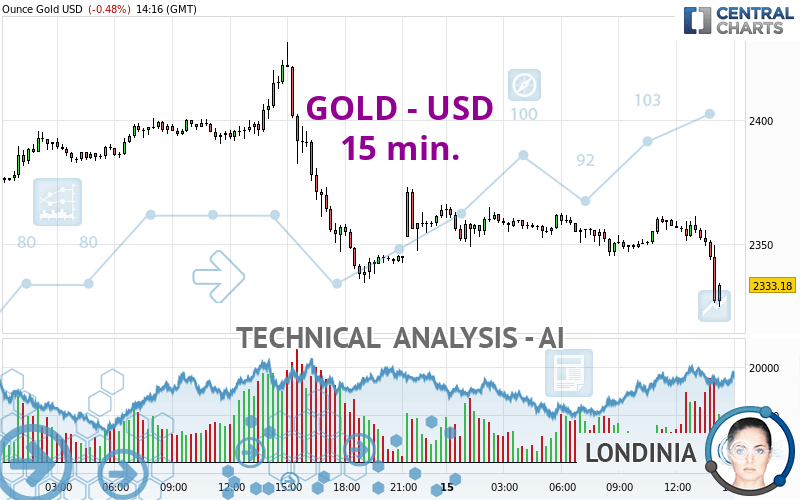
GOLD - USD - 15 min. - Technical analysis published on 04/15/2024 (GMT)
- 82
- 0
Click here for a new analysis!
- Timeframe : 15 min.
- - Analysis generated on
- Status : INVALID
Summary of the analysis

Additional analysis
Quotes
GOLD - USD rating 2,333.09 USD. The price is lower by -0.48% since the last closing with the lowest point at 2,324.35 USD and the highest point at 2,373.09 USD. The deviation from the price is +0.38% for the low point and -1.69% for the high point.The Central Gaps scanner detects a bullish opening. A small advantage for buyers in the very short term.
Bullish opening
Type : Bullish
Timeframe : Openning
Here is a more detailed summary of the historical variations registered by GOLD - USD:
Near a new HIGH record (5 years)
Type : Bullish
Timeframe : Weekly
Near a new HIGH record (1 year)
Type : Bullish
Timeframe : Weekly
Near a new HIGH record (1st january)
Type : Bullish
Timeframe : Weekly
Near a new HIGH record (1 month)
Type : Bullish
Timeframe : Weekly
Technical
Technical analysis of GOLD - USD in 15 min. shows a overall strongly bearish trend. 92.86% of the signals given by moving averages are bearish. The overall trend is supported by the strong bearish signals from short-term moving averages. The Central Indicators scanner does not detect any result on moving averages that would impact this trend.
In fact, according to the parameters integrated into the Central Analyzer system, 14 technical indicators out of 18 analysed are currently bearish. But beware of excesses. The Central Indicators scanner currently detects this:
CCI indicator is oversold : under -100
Type : Neutral
Timeframe : 15 minutes
Williams %R indicator is oversold : under -80
Type : Neutral
Timeframe : 15 minutes
MACD crosses DOWN its Moving Average
Type : Bearish
Timeframe : 15 minutes
Parabolic SAR indicator bearish reversal
Type : Bearish
Timeframe : 15 minutes
Momentum indicator is back under 0
Type : Bearish
Timeframe : 15 minutes
No signals are given by Central Patterns, a market scanner specialised in chart patterns, resistances and supports.
The presence of a bearish pattern in Japanese candlesticks detected by Central Candlesticks that could cause a correction in the very short term was also detected:
Long black line
Type : Bearish
Timeframe : 15 minutes
| S3 | S2 | S1 | Price | R1 | R2 | R3 | |
|---|---|---|---|---|---|---|---|
| ProTrendLines | 2,267.81 | 2,288.35 | 2,319.21 | 2,333.09 | 2,346.51 | 2,365.27 | 2,390.43 |
| Change (%) | -2.80% | -1.92% | -0.59% | - | +0.58% | +1.38% | +2.46% |
| Change | -65.28 | -44.74 | -13.88 | - | +13.42 | +32.18 | +57.34 |
| Level | Intermediate | Minor | Intermediate | - | Major | Major | Minor |
To determine price objectives, it is also possible to use the pivot points. Here is the price position in relation to pivot points:
| Pivot points | S3 | S2 | S1 | PP | R1 | R2 | R3 |
|---|---|---|---|---|---|---|---|
| Standard | 2,210.58 | 2,272.22 | 2,308.27 | 2,369.91 | 2,405.96 | 2,467.60 | 2,503.65 |
| Camarilla | 2,317.46 | 2,326.41 | 2,335.37 | 2,344.32 | 2,353.28 | 2,362.23 | 2,371.19 |
| Woodie | 2,197.79 | 2,265.82 | 2,295.48 | 2,363.51 | 2,393.17 | 2,461.20 | 2,490.86 |
| Fibonacci | 2,272.22 | 2,309.54 | 2,332.59 | 2,369.91 | 2,407.23 | 2,430.28 | 2,467.60 |
| Pivot points | S3 | S2 | S1 | PP | R1 | R2 | R3 |
|---|---|---|---|---|---|---|---|
| Standard | 2,159.08 | 2,231.02 | 2,287.67 | 2,359.61 | 2,416.26 | 2,488.20 | 2,544.85 |
| Camarilla | 2,308.96 | 2,320.75 | 2,332.53 | 2,344.32 | 2,356.11 | 2,367.90 | 2,379.68 |
| Woodie | 2,151.44 | 2,227.20 | 2,280.03 | 2,355.79 | 2,408.62 | 2,484.38 | 2,537.21 |
| Fibonacci | 2,231.02 | 2,280.14 | 2,310.49 | 2,359.61 | 2,408.73 | 2,439.08 | 2,488.20 |
| Pivot points | S3 | S2 | S1 | PP | R1 | R2 | R3 |
|---|---|---|---|---|---|---|---|
| Standard | 1,905.68 | 1,972.37 | 2,103.03 | 2,169.72 | 2,300.38 | 2,367.07 | 2,497.73 |
| Camarilla | 2,179.41 | 2,197.50 | 2,215.59 | 2,233.68 | 2,251.77 | 2,269.86 | 2,287.95 |
| Woodie | 1,937.66 | 1,988.36 | 2,135.01 | 2,185.71 | 2,332.36 | 2,383.06 | 2,529.71 |
| Fibonacci | 1,972.37 | 2,047.76 | 2,094.34 | 2,169.72 | 2,245.11 | 2,291.69 | 2,367.07 |
Numerical data
The following are the details of the technical indicators and moving averages that were collected to generate this technical analysis:
| RSI (14): | 26.05 | |
| MACD (12,26,9): | -2.4900 | |
| Directional Movement: | -29.50 | |
| AROON (14): | -85.71 | |
| DEMA (21): | 2,349.09 | |
| Parabolic SAR (0,02-0,02-0,2): | 2,360.58 | |
| Elder Ray (13): | -13.54 | |
| Super Trend (3,10): | 2,359.08 | |
| Zig ZAG (10): | 2,332.88 | |
| VORTEX (21): | 0.8200 | |
| Stochastique (14,3,5): | 21.19 | |
| TEMA (21): | 2,347.45 | |
| Williams %R (14): | -78.29 | |
| Chande Momentum Oscillator (20): | -24.70 | |
| Repulse (5,40,3): | -0.6000 | |
| ROCnROLL: | 2 | |
| TRIX (15,9): | -0.0100 | |
| Courbe Coppock: | 0.66 |
| MA7: | 2,344.12 | |
| MA20: | 2,258.40 | |
| MA50: | 2,145.24 | |
| MA100: | 2,089.36 | |
| MAexp7: | 2,343.79 | |
| MAexp20: | 2,351.48 | |
| MAexp50: | 2,354.81 | |
| MAexp100: | 2,359.36 | |
| Price / MA7: | -0.47% | |
| Price / MA20: | +3.31% | |
| Price / MA50: | +8.76% | |
| Price / MA100: | +11.67% | |
| Price / MAexp7: | -0.46% | |
| Price / MAexp20: | -0.78% | |
| Price / MAexp50: | -0.92% | |
| Price / MAexp100: | -1.11% |
News
The latest news and videos published on GOLD - USD at the time of the analysis were as follows:
-
 Gold Daily Forecast and Technical Analysis for April 15, 2024, by Chris Lewis for FX Empire
-
CASHING IN GOLD: Olympics to start awarding money to track and field winners
-
Gold Daily Forecast and Technical Analysis for April 11, 2024 by Bruce Powers, CMT, FX Empire
-
Gold Long Term Forecast and Technical Analysis for April 12, 2024, by Chris Lewis for FX Empire
-
Gold Daily Forecast and Technical Analysis for April 12, 2024, by Chris Lewis for FX Empire
About author

Online


Add a comment
Comments
0 comments on the analysis GOLD - USD - 15 min.